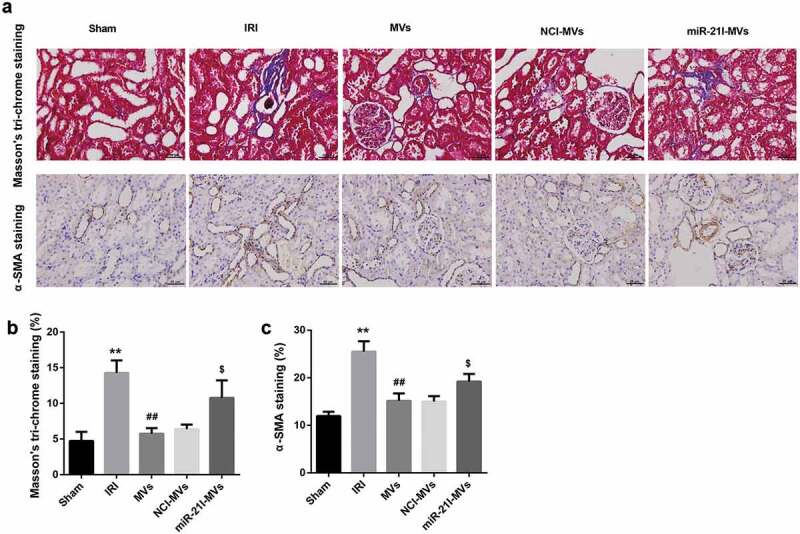
Figure 7.

Effects of MSC-MVs administration on the renal fibrosis. (a) Representative images of Masson’s trichrome staining and α-SMA immunostaining in the injured kidneys at 2 week after reperfusion treated with MSC-MVs (Scale bar = 25 μm). (b) Quantification of percentage of Masson staining positive area in the kidney sections after reperfusion with MSC-MVs. (c) Quantification of α-SMA-positive cells in the kidney sections after reperfusion with MSC-MVs. N = 8 in each group.
