Figure 3.

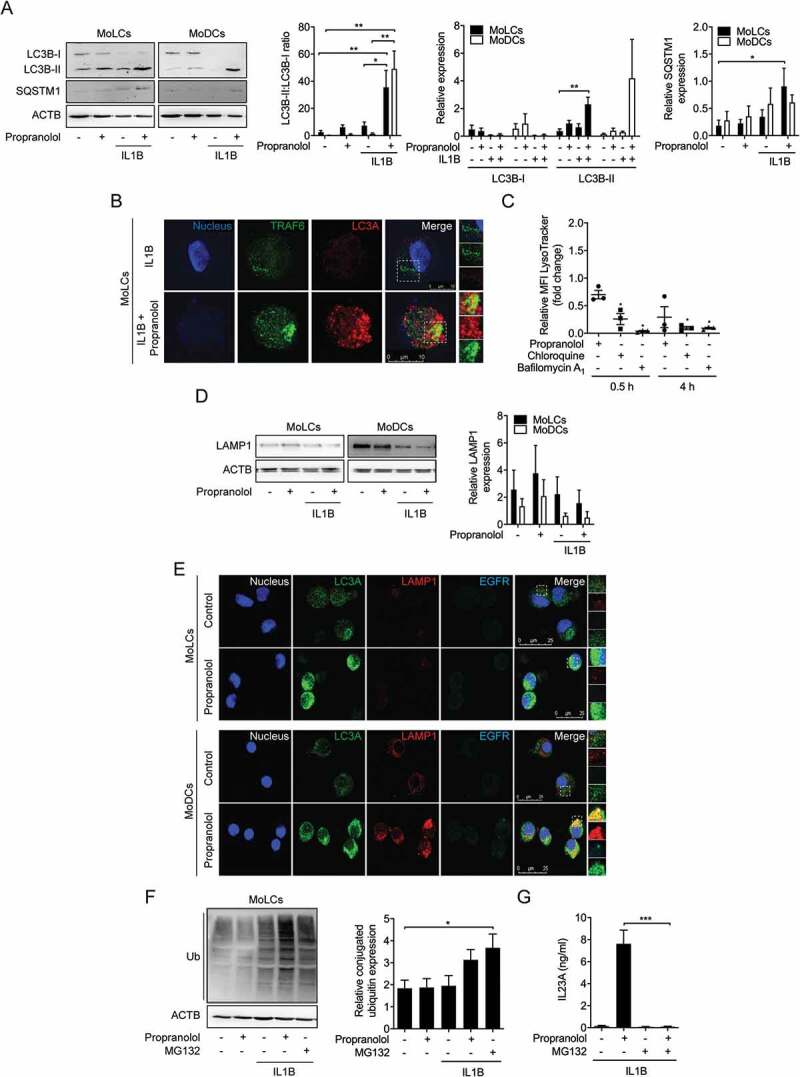
Propranolol inhibits autophagic flux and impairs endosomal maturation in MoLCs and MoDCs. (A and D) Immunoblot analysis of total LC3B-I, LC3B-II, SQSTM1, and LAMP1 expression in whole-cell lysates of MoLCs and MoDCs, stimulated with IL1B (20 ng/ml) for 24 h with or without propranolol (75 µM). (B) Immunostaining of IL1B-activated MoLCs for TRAF6 and LC3A after 24 h of stimulation with propranolol (75 µM). Scale bar represents 10 µm. (C) Acidification of intracellular compartments was examined by flow cytometry of MoLCs, incubated with propranolol (75 µM), chloroquine (20 µM) or bafilomycin A1 (1 µM) for 0.5 h or 4 h, respectively. Cells were pre-incubated for 0.5 h in medium supplemented with acidotropic LysoTracker Red DND-99 (100 nM). pH indicator-specific detection of mean fluorescence intensity (MFI) was quantified and depicted relative to untreated controls (assigned as 1.0). (E) Co-localization of LC3A and EGFR with LAMP1 was analyzed by immunofluorescence microscopy in MoLCs and MoDCs after 24 h of stimulation with propranolol (75 µM). Scale bar represents 25 µm. (F) Immunoblot analysis of whole-cell lysates from MoLCs probed with anti-Ub for total ubiquitin-conjugated constituents, stimulated with IL1B (20 ng/ml) for 24 h with or without propranolol (75 µM) or MG132 (10 µM). (G) IL23A release was analyzed by ELISA in the supernatant of IL1B-stimulated MoLCs (20 ng/ml) for 24 h in the presence or absence of propranolol (75 µM) or MG132 (10 µM). (A, D and F) Protein expression was quantified by densitometric analysis with ACTB/β-actin serving as control. (A, F and G) *P < 0.05, **P < 0.01, ***P < 0.001, one-way ANOVA test followed by Bonferroni posttest, (C) unpaired two-tailed t-test. Data are representative of n = 3–4 independent experiments and display mean values ± SEM.
