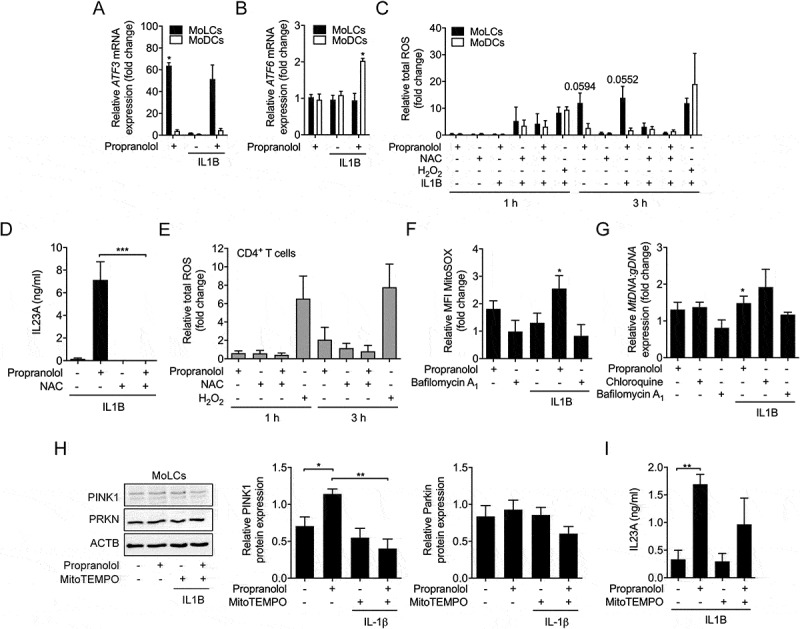
Figure 5.

Propranolol-induced inhibition of autophagic flux is accompanied by oxidative stress and abundance of ROS-producing mitochondria in MoLCs. (A and B) qRT-PCR quantification of ATF3 and ATF6 copy numbers in immature and IL1B-activated (20 ng/ml) DC subsets stimulated for 3 h with or without propranolol (75 µM). Levels of mRNA were normalized to GAPDH and presented relative to untreated DCs (set as 1.0). (C) Flow cytometry analysis of total intracellular ROS formation in IL1B-activated DCs, pre-incubated with ROS assay stain for 1 h and subsequently stimulated with or without propranolol (75 µM) and N-acetyl-L-cysteine (20 mM) for 1 h and 3 h, respectively. H2O2 (200 µM) was used as a positive control. ROS quantification is presented relative to unstimulated controls (set as 1.0). (D) MoLCs stimulated with IL1B (20 ng/ml) were stimulated with or without propranolol (75 µM) and NAC (20 mM). Levels of IL23A were detected by ELISA. (E) Flow cytometry analysis of total intracellular ROS formation in naïve CD4+ T cells, pre-incubated with ROS assay stain for 1 h and followed by stimulation with or without propranolol (75 µM) and N-acetyl-L-cysteine (20 mM) for 1 h and 3 h, respectively. H2O2 (200 µM) served as positive control. ROS levels were displayed relative to untreated controls (set as 1.0). (F) Detection of mitochondrial-generated ROS was examined by flow cytometry and mean fluorescence intensity (MFI) was quantified in immature and IL1B-stimulated MoLCs, pre-loaded with MitoSOX (5 µM) for 10 min and subsequently cultivated for 24 h in the presence or absence of propranolol (75 µM) or bafilomycin A1 (1 µM). Detected ROS were depicted relative to unstimulated MoLCs (set as 1.0). (G) Copy numbers of mitochondrial DNA (hmito3) in unstimulated and IL1B-stimulated (20 ng/ml) with or without propranolol (75 µM), chloroquine (20 µM) or bafilomycin A1 (1 µM) were assayed after 48 h. mtDNA was normalized to ALDOA, used as a loading control for genomic DNA and displayed relative to IL1B-activated cells (set as 1.0). (H) Immunoblot analysis of PINK1 and PRKN in whole-cell lysates from MoLCs obtained after 24 h of stimulation with IL1B (20 ng/ml) with or without propranolol (75 µM) or MitoTEMPO (20 µM). Protein expression was evaluated by densitometric analysis with ACTB/β-actin assisting as control. (I) ELISA of IL23A levels collected by MoLCs activated with IL1B (20 ng/ml) and stimulated with or without propranolol (75 µM) and MitoTEMPO (20 µM) for 24 h. (A-C, F and G) *P < 0.05, one-sample t-test. (D, H and I) *P < 0.05, **P < 0.01, ***P < 0.001, one-way ANOVA test followed by Bonferroni posttest. Data are representative of (A, D and I) n = 3, (B, C, E, F and H) n = 4, (G) n = 3–6 independent experiments and display mean values + SEM.
