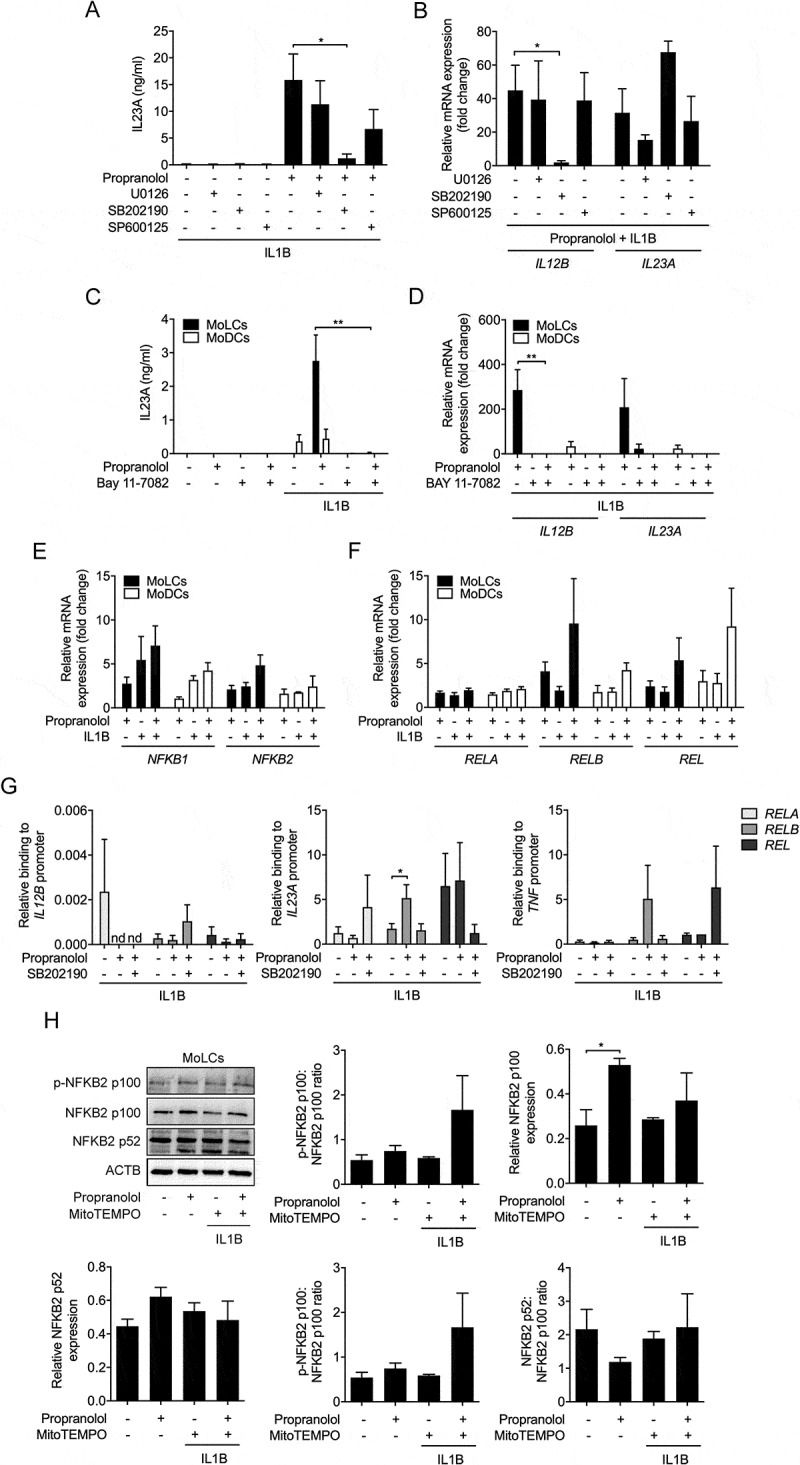
Figure 6.

MAPK14 activity crucially regulates IL23A release. (A) IL23A secretion was analyzed by ELISA of IL1B-stimulated (20 ng/ml) MoLCs, stimulated for 24 h with or without propranolol (75 µM) in the presence or absence of a selective MAPK1-MAPK3 inhibitor (U0126, 10 µM), inhibitor of MAPK14 (SB 202,190, 10 µM) and MAPK8 inhibitor (SP 600,125, 10 µM). (B) Analysis of IL12B and IL23A mRNA expression in IL1B-activated (20 ng/ml) and propranolol-stimulated (75 µM) MoLCs with or without U0126 (10 µM), SB 202,190 (10 µM) or SP 600,125 (10 µM), respectively after 24 h. Gene transcripts were normalized to GAPDH and depicted relative to IL1B-activated MoLCs concomitantly treated with propranolol (set as 1.0). (C) IL23A release by immature and IL1B-activated (20 ng/ml) DC subsets after 24 h in presence or absence of propranolol (75 µM) and NFKB inhibitor Bay 11–7082 (10 µM) was determined by ELISA. (D) Levels of IL12B and IL23A mRNA expression in MoLCs and MoDCs, stimulated with IL1B (20 ng/ml) for 24 h with or without propranolol (75 µM) and Bay 11–7082 (10 µM). Gene copy numbers were normalized to GAPDH and presented relative to respective IL1B-stimulated DCs (set as 1.0). (E and F) Analysis of NFKB1 and NFKB2 as well as RELA, RELB and REL mRNA expression in MoLCs and MoDCs, activated with IL1B (20 ng/ml) alone or with propranolol (75 µM) for 3 h. Levels of mRNA were normalized to GAPDH and displayed relative to untreated controls (set as 1.0). (G) Binding of RELA, RELB and REL to promoters of IL12B, IL23A and TNF in MoLCs stimulated for 4 h with IL1B (20 ng/ml) in presence or absence of propranolol (75 µM) and inhibitor of MAPK14 (SB 202,190, 10 µM), respectively, assayed by ChIP and subsequently quantified by qRT-PCR. Data are presented relative to total input DNA (GAPDH). (H) Immunoblot analysis of total NFKB2 p100, NFKB2 p-NFKB2 p100, and NFKB2 p52 expression in whole-cell lysates of MoLCs, stimulated with IL1B (20 ng/ml) for 24 h with or without propranolol (75 µM) and MitoTEMPO (20 µM). (H) Protein expression was assessed by densitometric analysis with ACTB as control. (A-D, G and H) *P < 0.05, **P < 0.01, one-way ANOVA test followed by Bonferroni posttest. Data are representative of (A) n = 5, (B and H) n = 4, (C) n = 3, (D-F) n = 3–4, (G) n = 5–7 independent experiments and display mean values + SEM.
