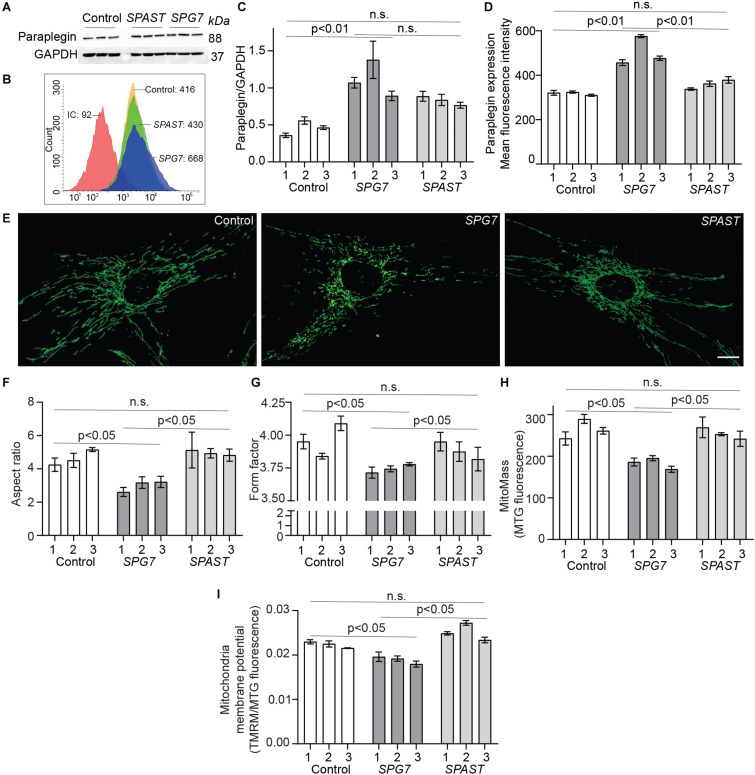
FIGURE 2.
Paraplegin expression, mitochondrial morphology, and membrane potential in control, SPG7, and SPAST patient cells. (A) Western blot analysis of paraplegin and GAPDH expression. (B) Representative flow cytometry histogram of paraplegin fluorescence intensities. IC: Isotype control. (C) Western blot densitometry band quantification showing paraplegin expression normalized to GAPDH expression. (D) Paraplegin mean fluorescence intensity quantified by flow cytometry. (E) Representative images of MitoTracker-labeled mitochondria in cells from control, SPG7, and SPAST patient cells. Scale bar: 10 μm. (F,G) Mitochondria morphological analysis showing aspect ratio (mitochondria length) and form factor (degree of branching). (H) Mitochondrial mass was calculated as the fluorescence intensity of MitoTracker green (MTG) labeled mitochondria. (I) Mitochondrial membrane potential was measured using tetramethylrhodamine methyl ester (TMRM) fluorescence and normalized to mitochondrial mass (MTG fluorescence). Data presented as mean ± SEM. The bars present data from the three technical replicates. One-way analysis of variance with Tukey’s multiple comparisons test was performed to compare control, SPG7, and SPAST groups. n.s., not significant.

