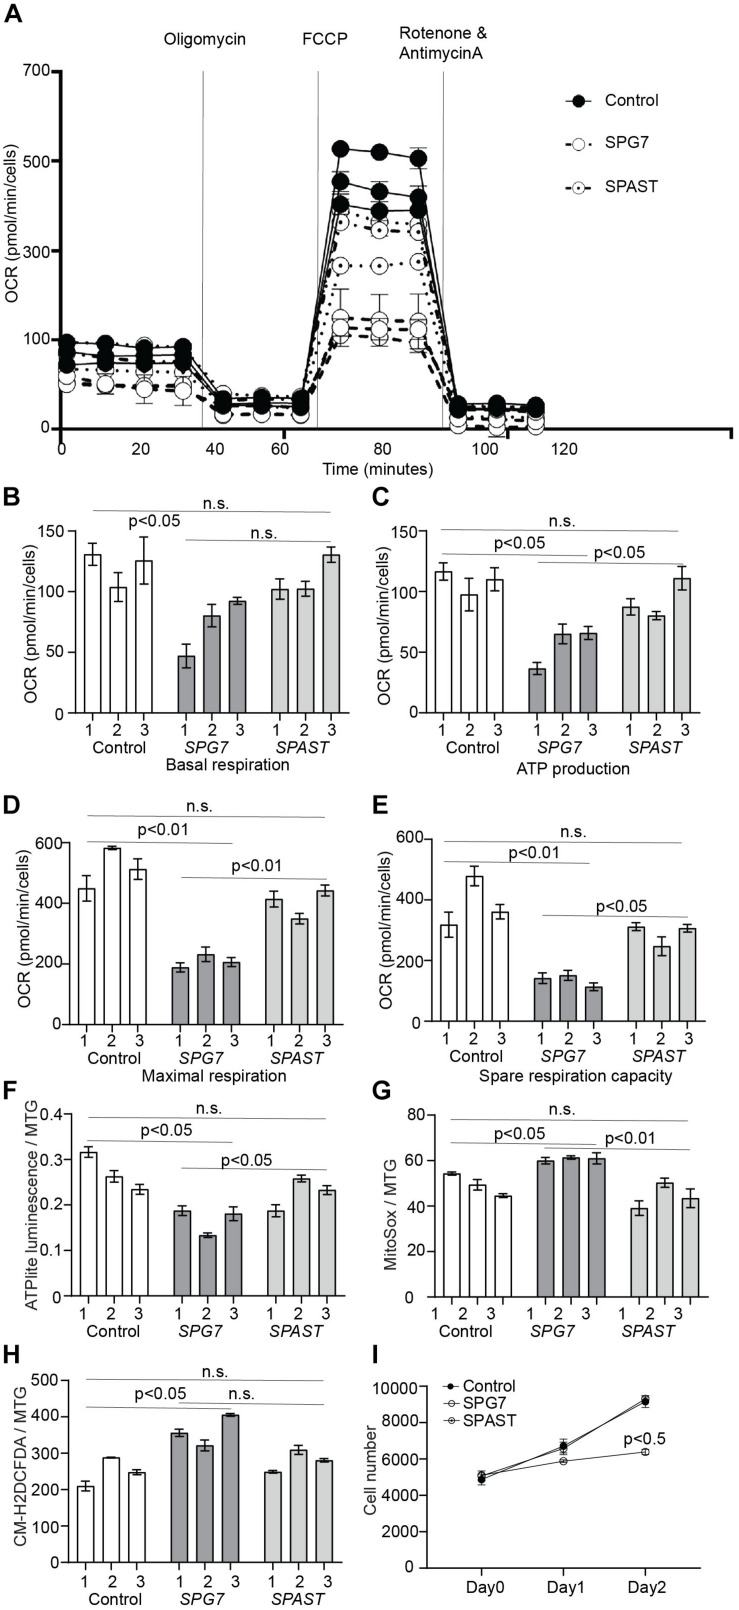
FIGURE 3.
Oxidative respiration and oxidative stress in control, SPG7, and SPAST patient cells. (A) Representative graph of mitochondrial respiration determined by measuring OCR (mean ± SE) using the Seahorse-based assay. (B–E) Comparison of different aspects of mitochondrial respiration (F) ATP content in the cells was measured using the ATPlite assay kit and normalized to mitochondrial mass [MitoTracker green (MTG) fluorescence]. (G) Mitochondrial oxidative stress was measured using MitoSOX (mitochondrial superoxide indicator) fluorescence and normalized to mitochondrial mass (MTG fluorescence). (H) General oxidative stress was measured using the CM-H2DCFDA (general oxidative stress indicator) assay kit and normalized to mitochondrial mass (MTG fluorescence). (I) Cellular proliferation was measured for on day 0 (4 h after cell seeding), day 1, and day 2 using CyQUANT assay. Data presented as mean ± SEM. The bars present data from three technical replicates. One-way analysis of variance with Tukey’s multiple comparisons test was performed to compare control, SPG7, and SPAST groups. n.s., not significant.

