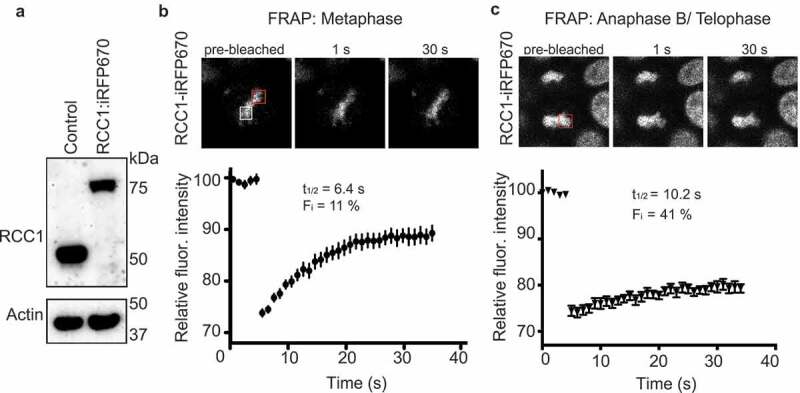
Figure 1.

Dynamics of endogenous RCC1 on mitotic chromatin. (a) Western blotting with anti-RCC1 antibodies of parental HCT116 cells (left lane) and in cells in which endogenous RCC1 is tagged with iRFP670-P2A-TIR1 (second lane). Note the RCC1 mobility shift after insertion. Actin is shown as a loading control (lower panel). (b, c) Fluorescence Recovery after Photobleaching (FRAP) analysis of RCC1 in HCT116RCC1-iRFP670 cells during metaphase (b) or anaphase B/telophase (c). White square indicates the position of analyzed region. Red square indicates the region used for estimation of Fmax (see Materials and Methods). Results are expressed as an average from a total of 12 measurements recorded from 3–4 independent experiments. Note that RCC1 is highly mobile during metaphase.
