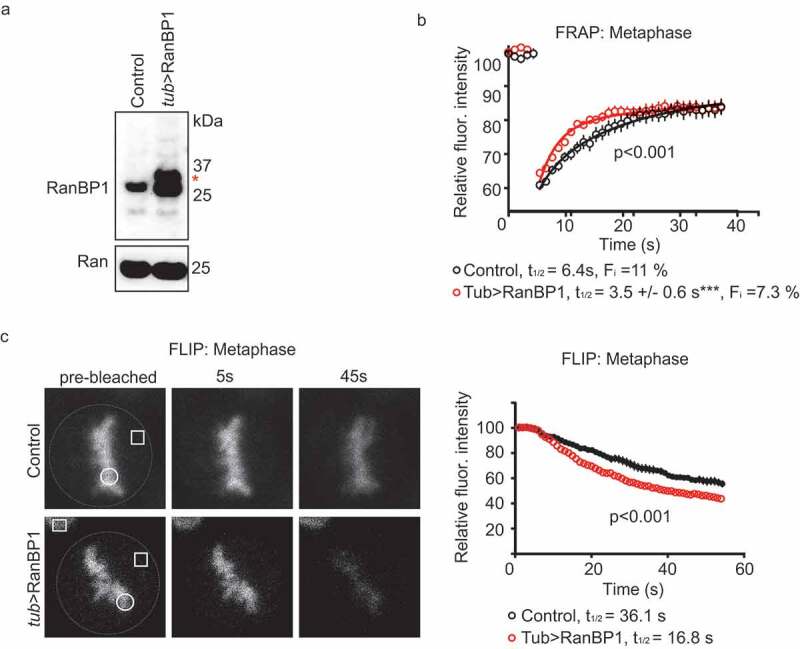
Figure 2.

Over-expression of RanBP1 increases RCC1 dynamics on chromatin during metaphase. (a) Western blotting with anti-RanBP1 antibodies of parental HCT116 cells (left lane) and cells in which RanBP1 is over-expressed by using endogenous alpha-tubulin promoter (tub>RanBP1, right lane). Ran is shown as a loading control (lower panel). (b) FRAP analysis of cells overexpressing RanBP1 (red). The graph representing dynamics of RCC1 in parental cells (black) is the same as shown in Figure 1b). (c) Fluorescence Loss in Photobleaching (FLIP) analysis of cells, as in (B). White dash line outlines the mitotic cell, white square indicates the bleached region and white circle indicates the ROI. Yellow square denotes the position of control ROI in neighboring interphase cell, used for measuring nonspecific loss of fluorescence during experiment (Fc). Results are expressed as an average ± SEM from a total of 12 measurements recorded from 3–4 independent experiments. p < 0.001 (F test).
