
Figure 5.
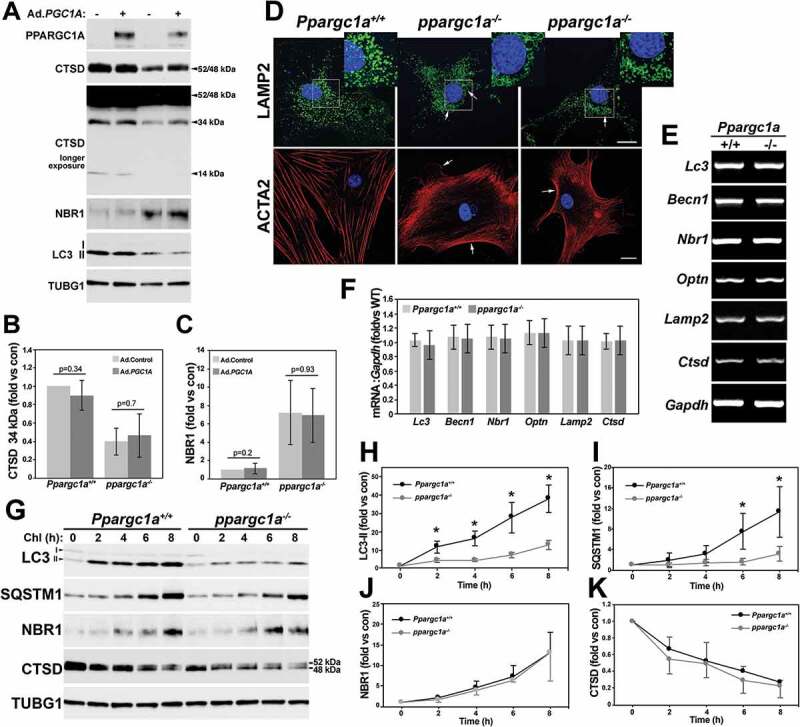
PPARGC1A regulates autophagic flux. Ppargc1a+/+ and ppargc1a−/- VSMCs were infected with 5 × 10⁷ PFU of Ad.Control or Ad.PGC1A. 3 d after infection cells were lysed and samples tested for the indicated antibodies (A). The expression of the 34-kDa form of CTSD and NBR1 was adjusted by TUBG1 and expressed as fold change, compared with WT cells infected with Ad.Control (B and C). Ppargc1a+/+ and ppargc1a−/- VSMCs were fixed in 4% PFA and incubated with antibodies against LAMP2 or ACTA2, and images were acquired using a confocal microscope. Bar: 10 μm (D). mRNA from both genotypes was tested for the expression of the autophagy and lysosomal markers shown in E (n = 3 samples per genotype). mRNA levels were adjusted by Gapdh and expression expressed as fold change, compared with WT cells (F). Cells were treated with 50 μM Chl in DMEM containing 0.5% FBS for 2 to 8 h. Cells were then lysed and separated in 4–20% Precast Criterion gels (G). LC3-II, SQSTM1, NBR1, and CTSD protein levels were adjusted by TUBG1 (H-K). Expression of each marker in untreated cells was assigned as 1. Fold changes were then calculated for each genotype to assess the rate of protein accumulation or reduction. * denotes p < 0.05.