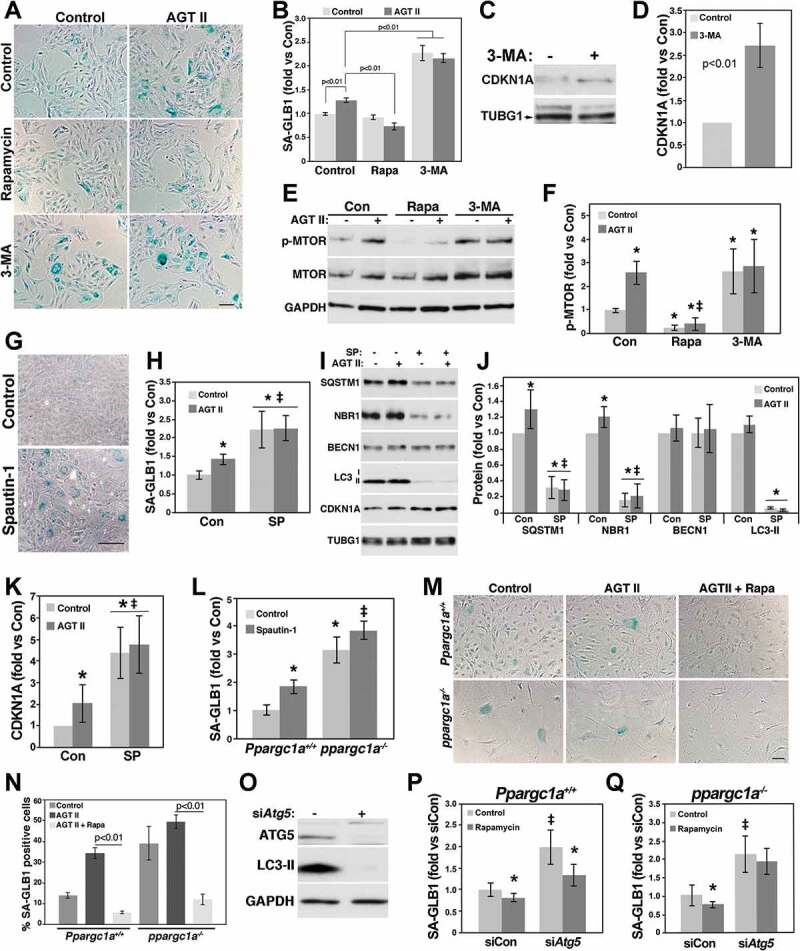
Figure 6.

Impaired autophagy induces senescence of VSMCs. RASMs treated with and without 10 mM 3-MA or 100 nM rapamycin (Rapa) were treated with and without 100 nM AGT II for 3 d. Cells were then fixed and tested for SA-GLB1 activity measurements (A and B) or were lysed for the analysis of CDKN1A expression (C and D) and MTOR phosphorylation (E and F) by western blot. RASMs were incubated with 10 μM spautin-1 (SP) for 3 d for measurements of SA-GLB1 activity (G and H) or were treated with and without 100 nM AGT II and 10 μM spautin-1 for 3 d for protein expression analysis (I). Protein levels shown in I were adjusted by TUBG1 and expressed as fold change compared with control untreated cells (J and K). * and ‡ denote significant differences compared with control and AGT II, respectively. Ppargc1a+/+ and ppargc1a−/- VSMCs were treated with 10 μM spautin-1 (L) or with and without 100 nM AGT II and 100 nM rapamycin (M and N) for 3 d for SA-GLB1 activity measurements. WT MASMs were transfected with 200 nM siControl or siAtg5 and protein expression of ATG5 was determined by western blot (O). Ppargc1a+/+ and ppargc1a−/- VSMCs transfected with siControl or siAtg5 were treated with 100 nM rapamycin for 3 d (P and Q). SA-GLB1 was then expressed a fold change compared with untreated siControl cells. * and ‡ denote significant differences between cells treated with and without rapamycin and between siControl and siAtg5-transfected cells, respectively. Bar: 20 μm in A and 100 μm in G and M.
