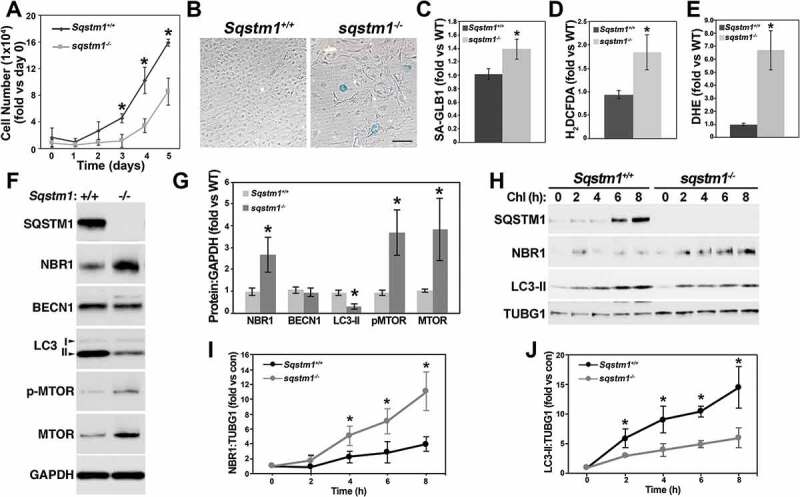
Figure 8.

Sqstm1 deficiency increases ROS levels and senescence and reduces autophagic flux. WT and sqstm1−/- VSMCs were cultured in DMEM with 10% FBS for cell proliferation experiments (A) (triplicates in 3 independent experiments), analysis of SA-GLB1 activity (B and C), and hydrogen peroxide (D) and superoxide (E) levels, or for analysis of protein expression (F). Expression of markers in F was adjusted by GAPDH and expressed as fold change, compared with WT cells (G). WT and sqstm1−/- VSMCs were treated with 50 μM Chl for 2 to 8 h for the analysis of autophagic flux (H). The expression of NBR1 (I) and LC3-II (J) levels was adjusted by TUBG1. The value of untreated cells was calculated as 1. Fold change compared with untreated cells was then calculated for each genotype. * denoted p < 0.05. Bar: 100 μm in B.
