
Figure 1.
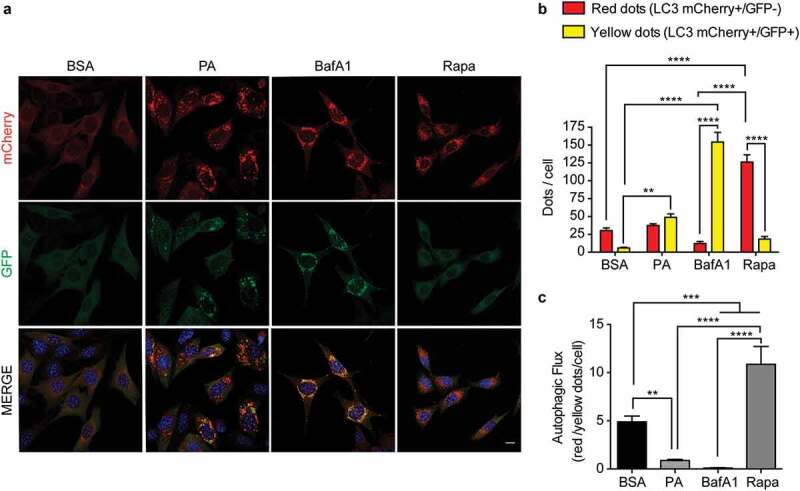
Palmitic acid reduces the autophagic flux in N43/5 cells. (A) Representatives images of N43/5 cells expressing the tandem fluorescent-tagged LC3 (mCherry-GFP-LC3), treated with BSA, PA (100 μM) or BafA1 (100 nM) for 6 h, or with Rapamycin (Rapa) 1 µM for 3 h. Scale bar: 10 μm. Nuclei were stained with DAPI (blue). (B) Quantification of LC3 dots per cell. Red bars represent the number of mCherry positive dots (autolysosomes; mCherry+/GFP-) and yellow bars the number of mCherry and GFP dots that colocalize (immature autophagosomes; mCherry+/GFP+). (C) Autophagic flux was determined by quantifying the ratio between red and yellow-positive puncta per cell. Data are presented as mean ± SEM, **p < .01,***p < .001, ****p < .0001. n = 3.