
Figure 3.
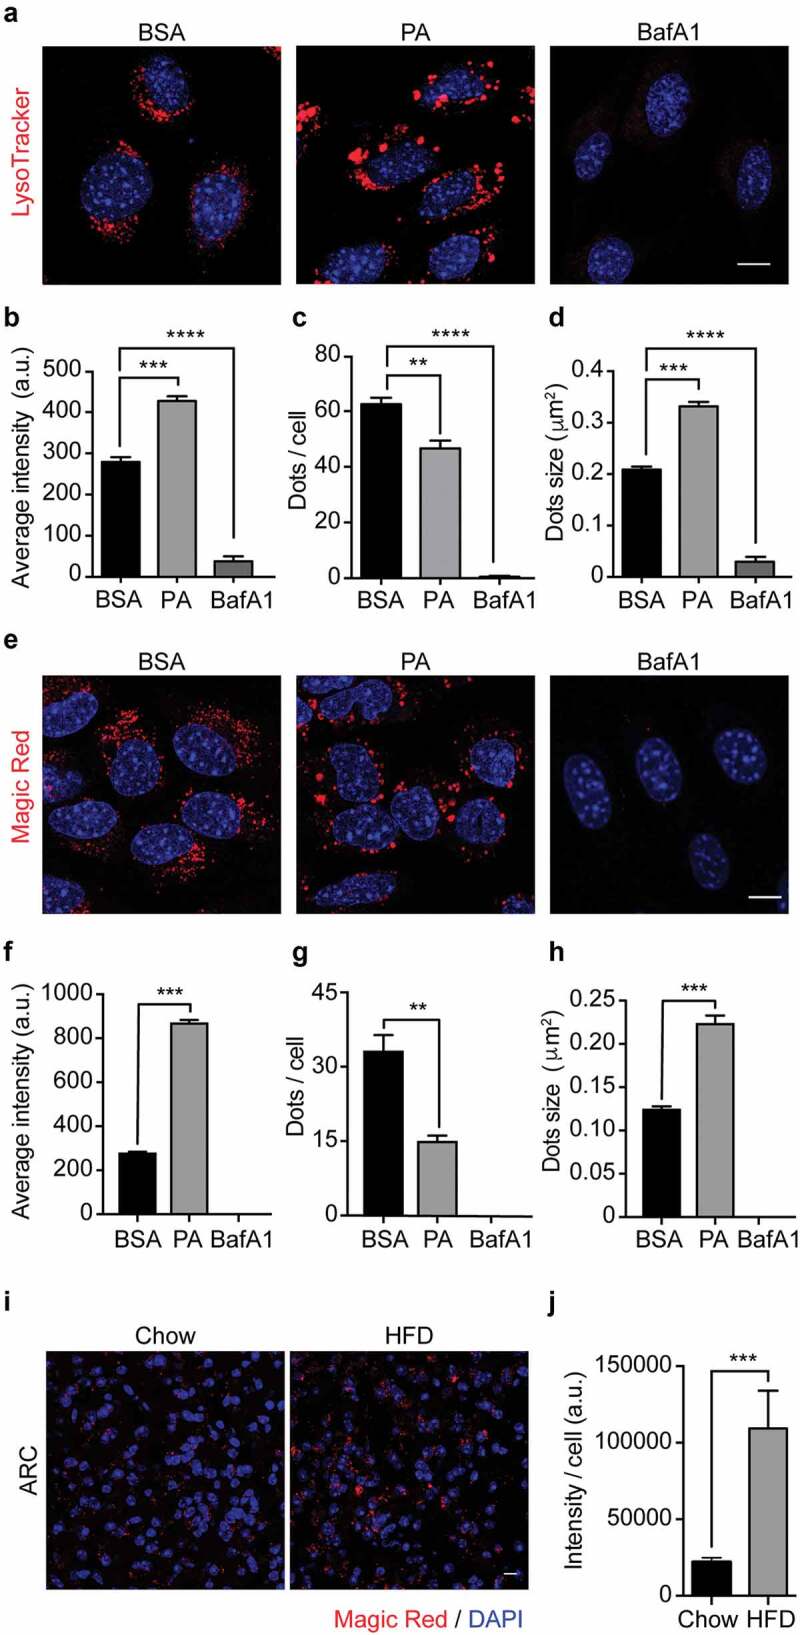
Palmitic acid does not reduce lysosomes acidity or lysosomal cathepsin B activity. (A) Representative confocal images of N43/5 cells treated with BSA, PA (100 μM), or BafA1 (100 nM) for 6 h and stained with LysoTracker. Nuclei were stained with DAPI (blue). Quantification of LysoTracker average fluorescence intensity in arbitrary units (a.u.), LysoTracker positive dots per cell and dots size are shown in (B), (C), (D), respectively. Scale bar: 10 μm. (E) Representative confocal images of N43/5 cells treated with BSA, PA (100 μM), or BafA1 (100 nM) for 6 h and stained with Magic Red, with its respective quantification of average fluorescence intensity in arbitrary units (a.u.) (F), number of positive dots per cell (G), and dots size (H). Nuclei were stained with Hoechst (blue). Scale bar: 10 μm. (I) Representative confocal images of the hypothalamic arcuate nucleus (ARC) from chow and HFD mice stained with Magic Red, with its respective quantification, in arbitrary units (a.u.) (J). Nuclei were stained with DAPI (blue). Scale bar: 10 μm. Data are presented as mean ± SEM, **p < .01, ***p < .001, ****p < .0001. n = 3.