
Figure 2.
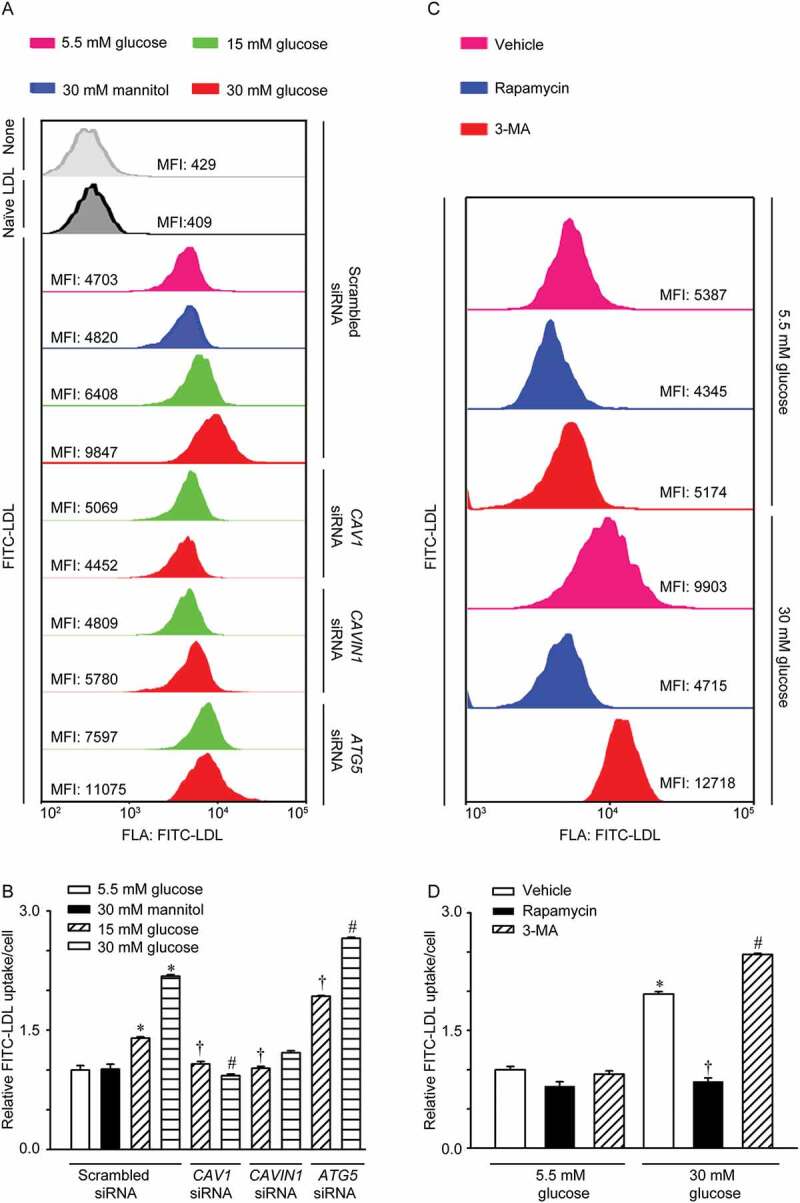
Increased LDL uptake in HUVECs treated with high glucose. (A, B) HUVECs were transfected with scrambled siRNA (20 nM), CAV1 siRNA (20 nM), or CAVIN1 siRNA (20 nM) for 48 h, followed by treatment with glucose (5.5 mM, 15 mM or 30 mM) or mannitol (5.5 mM glucose+24.5 mM mannitol) for 24 h and FITC-LDL treatment for 3 h. Cells were harvested using 0.125% trypsin and the uptake of LDL was measured by flow cytometry analysis. (A) Representative flow cytometry images show the MFI of HUVECs. (B) Quantification summary of FITC-LDL uptake in HUVECs. (C, D) HUVECs were treated with rapamycin (5 nM, 24 h) or 3-MA (5 mM, 4 h) with different concentrations of glucose (5.5 mM, 30 mM, 24 h), after which LDL uptake was evaluated. (C) Representative images of flow cytometry analysis indicate the MFI of HUVECs. (D) Quantification summary of FITC-LDL uptake in HUVECs. * p < 0.05 versus scrambled siRNA+ 5.5 mM glucose or 5.5 mM glucose alone; † p < 0.05 versus scrambled siRNA+15 mM glucose or 30 mM glucose alone, # p < 0.05 versus scrambled siRNA+30 mM glucose (n = 4).