
Figure 6.
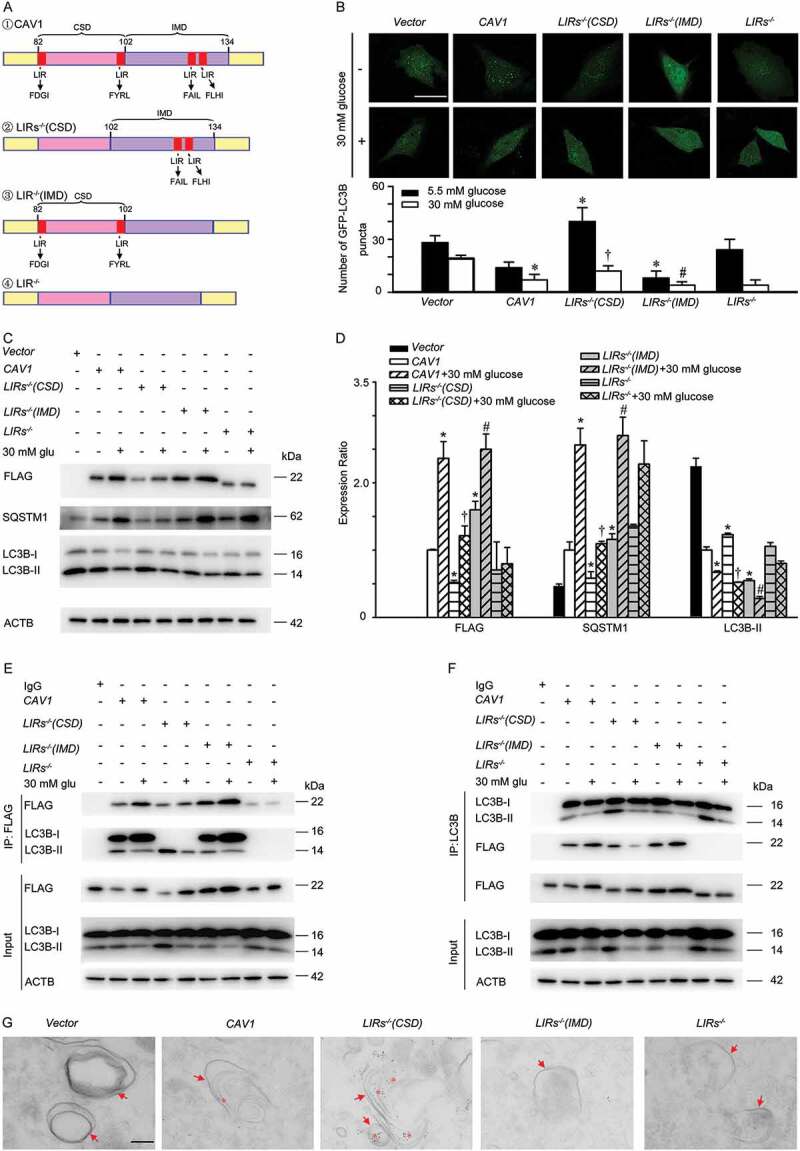
LC3B interacts with the CSD in CAV1 to inhibit autophagy, but interacts with the IMD in CAV1 to activate autophagy. (A) Schematic representation of the plasmids carrying Flag-CAV1 or Flag-CAV1 mutants, CAV1: CAV1 wild type; LIRs−/-(CSD): CAV1 mutant carrying the defective LIRs in the CSD; LIRs−/-(IMD): CAV1 mutant carrying the defective LIRs in the IMD; LIRs−/-: CAV1 mutant carrying the defective LIRs in both the CSD and IMD. (B) HUVECs were transfected with plasmids encoding Flag-CAV1 wild type (0.4 μg) or Flag-CAV1 mutants (0.4 μg) respectively, and co-transfected with GFP-LC3B plasmids for 24 h, followed by 30 mM glucose (glu) treatment for 24 h. GFP-LC3B puncta was visualized by confocal microscopy. Representative fluorescent images are shown (upper panel). Scale bars: 15 μm. The number of GFP- LC3B puncta in each cell was quantified, and at least 50 cells were included for each group (lower panel). * p < 0.05 versus CAV1 + 5.5 mM glucose; † p < 0.05 versus LIRs−/- (CSD) + 5.5 mM glucose; # p < 0.05 versus LIRs−/- (IMD) + 5.5 mM glucose (n = 3). (C-F) HUVECs were transfected with plasmids encoding Flag-CAV1 wild type (0.4 μg) or Flag-CAV1 mutant (0.4 μg) for 24 h, and treated with high glucose (30 mM, 24 h). Whole-cell lysates from HUVECs were subjected to immunoblot analysis to determine Flag-CAV1, LC3B, and SQSTM1 levels. glu: glucose Representative western blotting analysis of the indicated proteins (C) and summary bar graph showing the expression of the indicated proteins (D). n = 3. * p < 0.05 versus CAV1; † p < 0.05 versus LIRs−/- (CSD); # p < 0.05 versus LIRs−/- (IMD). (E-F) Whole-cell lysates from HUVECs treated as above mentioned, and then immunoprecipitated with Flag antibody (E; IP: Flag) or LC3B antibody (F; IP: LC3B). Cellular ACTB derived from the same samples for IP experiments served as a loading control. glu: glucose. (G) HUVECs were transfected with plasmids encoding, vector or GFP-CAV1 (0.4 μg) or GFP-CAV1 mutants (0.4 μg) respectively, and then were analyzed by immuno-electron microscopy using primary antibody against GFP and 4 nm colloidal gold affinipure goat anti-mouse IgG as secondary antibody. Arrow, autophagosomes or autolysosomes; Asterisk, 4 nm colloidal gold in autophagosomes or autolysosomes; scale bar: 200 nm.