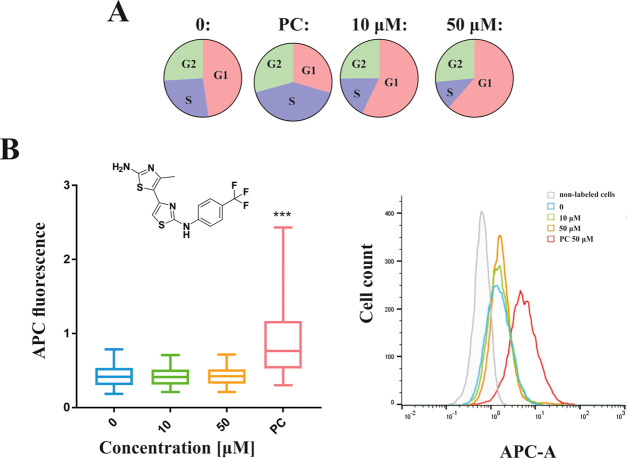
Figure 7.
Cell cycle analysis and induction of the DNA double-stand breaks (DSBs) by the substituted 4,5′-bithiazole compound 1. (A) Percent of HepG2 cells in certain phases of cell cycle after 24 h treatment to compound 1 at 50 and 10 μM in comparison to the solvent control (0). Etoposide (50 μM) was used as a positive control (PC). (B) Results of the analyses of DNA double-strand break induction assessed by γ-H2AX assay. (Left) The results are presented as the distribution of fluorescent signals of individual cells. Data are presented as quantile box plots with the 25th and 75th percentiles (edges of the box), the median value (line through the box), and the bars representing 95% confidence intervals. Ten thousand events were recorded in each sample, and three independent experiments were performed. Significant difference between solvent control (0.5% DMSO; indicated by 0) and treated cells is shown by ***p < 0.001. A positive control (PC; 50 μM etoposide) was included in each parallel. (Right) Representative histograms for nonlabeled cells, vehicle control (0), compound 1 (10 and 50 μM), and etoposide (50 μM).

