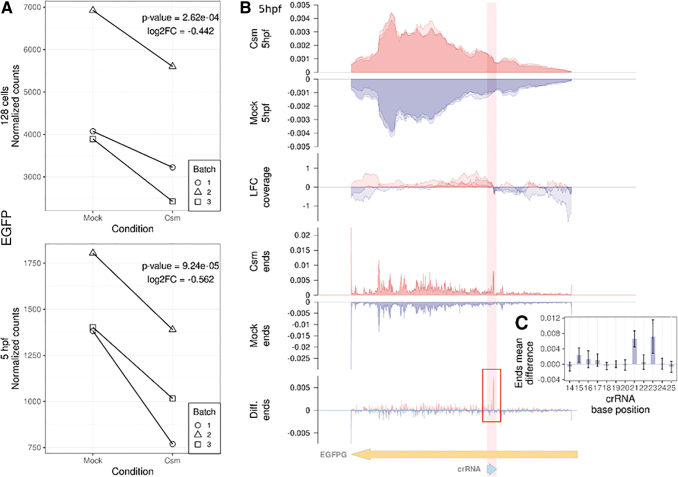
FIG. 5.
Analysis of on-target effects of EGFP knockdown. (A) Changes in EGFP read counts at the 128-cell stage (top panel) and 5 hours post fertilization (bottom panel). Black lines connect data points from the same replica batch. Each plot is annotated with log2 fold change value and P-value from the likelihood-ratio test. (B) Read coverage analysis of the EGFP transcript at 5 hpf. The top two panels (StCsm 5 hpf and mock 5 hpf) depict the read coverage represented as a fraction of total coverage at each position for the StCsm injected (red) and mock injected (blue) samples. Each replicate is plotted independently with the color shades gaining intensity where the plots overlap. The third panel (log-fold change [LFC] coverage) shows the log2 of the ratio between the read coverage of the StCsm injected and mock injected samples (positive values red, negative values blue). The fourth and fifth panel (StCsm ends and Mock ends) depicts the distribution of sequencing fragment ends over the whole EGFP transcript sequence for the StCsm injected (red) and mock injected (blue) samples. The sixth panel (Diff. ends), shows the difference in the sequencing fragment end distribution between the two samples, obtained by subtracting the mean amount of fragment ends of the mock sample from the mean amount of fragment ends at each coordinate of the StCsm sample. The positive values are colored red and negative are blue. The red rectangle illustrates the space enlarged on panel (C) in relation to the CRISPR RNA (crRNA) sequence. (C) The difference in the sequencing fragments end means at each coordinate in relation to the crRNA sequence. Error bars show 95% confidence interval.

