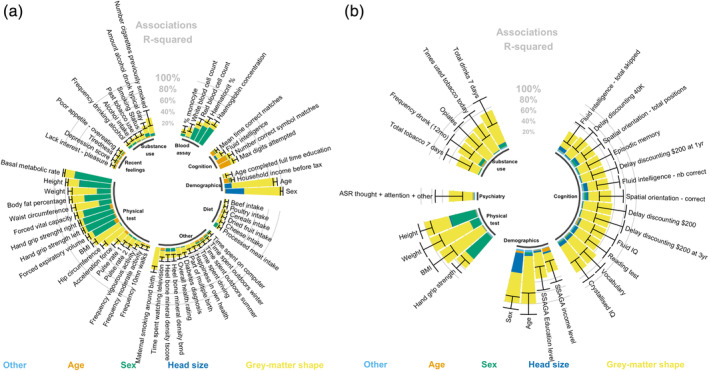
FIGURE 2.

Circular barplot of the associations (R2) between phenotypes and grey‐matter structure vertices (morphometricity). For clarity, we only plotted the significant associations in the UKB discovery (Panel a) and HCP sample (Panel b). We applied Bonferroni correcting to account for multiple testing in each sample. The black bars represent the 95% confidence intervals of the morphometricity estimates. For context, we also present the association R 2 between phenotypes and covariates of the baseline model, as per the legend under the barplot. As some covariates may be correlated, the R 2 was calculated by adding progressively the covariates in that order: acquisition and processing variables (labelled “other”), age, sex and head size (ICV, total cortical thickness and surface area). Age and sex were not included as covariates when studying them as phenotypes. See Data set S3, S4 for full results. See Figure S1 for positive control associations
