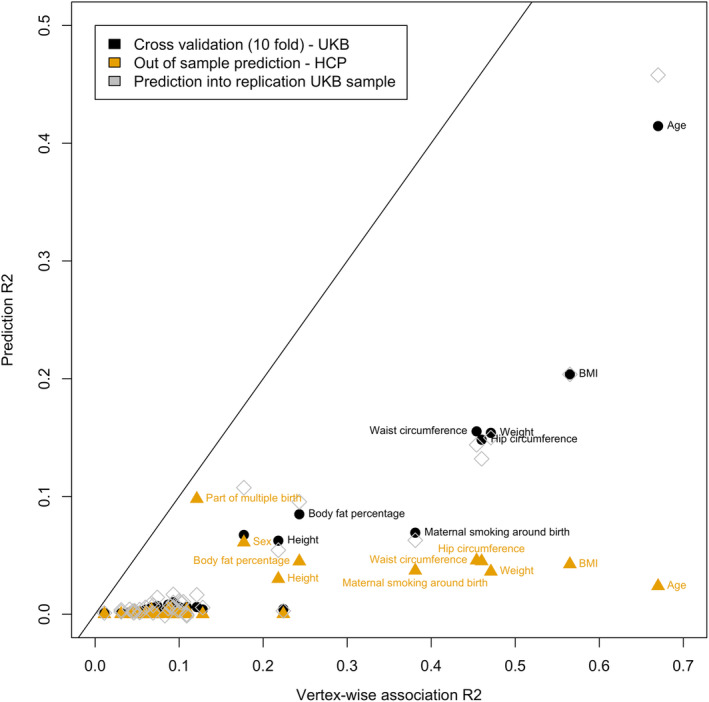
FIGURE 4.

In sample and out of sample prediction accuracy as a function of the total association R 2. Labels highlight some of the significant prediction having the greatest accuracy. As predicted by the theory, the prediction accuracy is capped by the total association R 2 (points below the diagonal). We limited the prediction analysis to phenotypes showing a significant brain‐morphometricity in the UKB discovery sample
