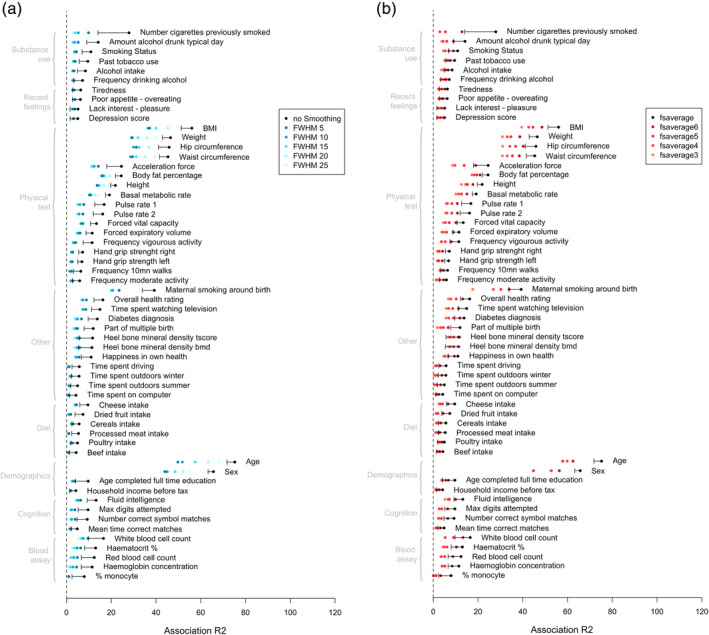
FIGURE 5.

Comparison of brain‐morphometricity estimates varying cortical processing options in FreeSurfer. The reduction of brain‐morphometricity as a function of mesh smoothing is presented on the left panel (a), while the right panel (b) shows the effect of reducing the cortical mesh complexity. The black bar indicates the lower bound of the 95% confidence interval of the fsaverage‐no smoothing estimate (identical to results presented in Figure 2, except that covariates R 2 are not plotted here to simplify the figure). Brain‐morphometricity estimates below the 95%CI lower bound cannot be deemed significantly lower. Rather the 95%CI are presented for context and to remind that all estimate from Figure 2 do not have the same SE. See Table S3 for a conservative list of phenotypes with significantly reduced morphometricity compared with fsaverage—no smoothing
