
FIGURE 6.
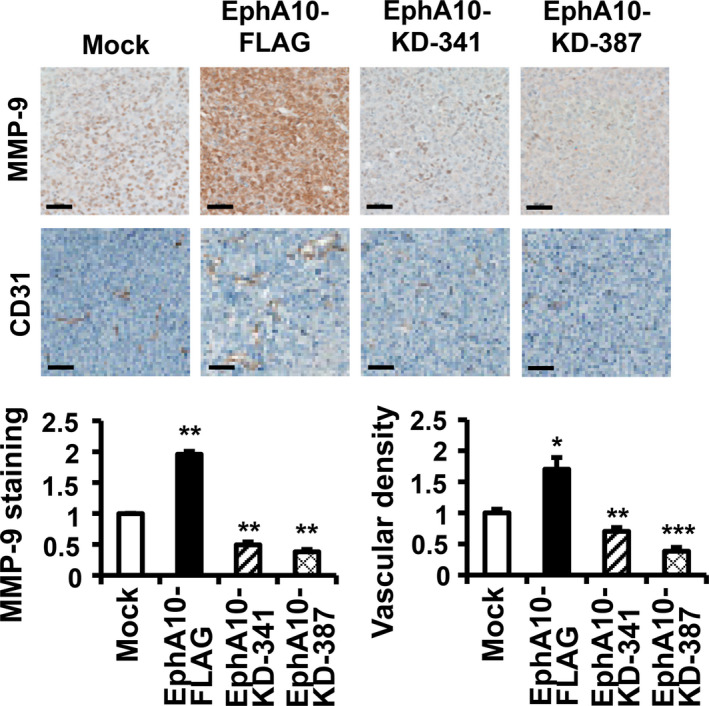
Analysis of MMP‐9 level and vascular density in the xenograft model for EphA10. Representative images of IHC staining for MMP‐9 and CD‐31 in the tumor of xenograft model using MIA PaCa‐2 cells mock‐transfected, overexpressing (EphA10‐FLAG), or silencing (EphA10‐KD‐341 and ‐387) of EphA10 are shown. The scale bars represent 50 μm. The relative intensity of the MMP‐9 and CD‐31 (vascular density) staining is quantified below the images. Each bar represents the mean ± SD of 3 mice. *P < .05, **P < .01, ***P < .001 vs mock‐transfected cells