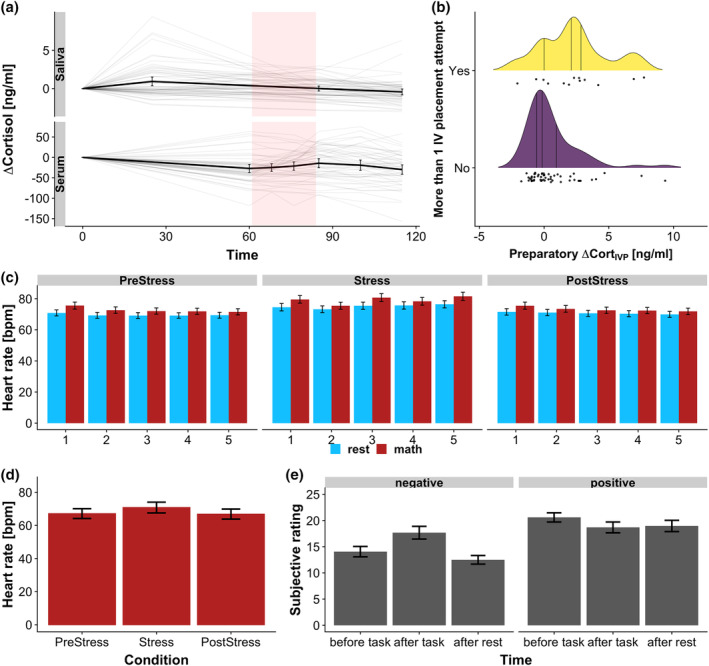
FIGURE 2.

The intravenous catheter placement (IVP) and the stress task increased stress levels. (a) Cortisol response (∆Cortisol) over time. IVP just before T1 increased average salivary cortisol at T2. Thin lines depict individual cortisol profiles, thick lines depict the group average. Shaded rectangles indicate the stress task phase. (b) IVP‐induced cortisol responses were higher after complicated placement, for example, if more than one attempt was needed. (c) The average pulse rate was higher during the cognitive task (math) compared to rest phases across all task blocks. (d) The average pulse rate in math phases of the Stress condition was higher compared to PreStress and PostStress. Notably, the average pulse rate did not completely recover. (e) Stress increased negative emotions and decreased positive emotions. Increases in negative emotions were transient and recovered back to baseline levels, while positive emotions remained reduced. Error bars depict 95% confidence intervals
