FIGURE 3.

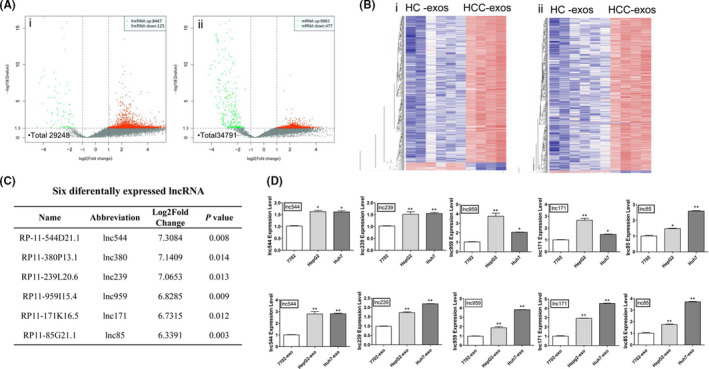
Differentially expressed long noncoding RNAs (DE‐lncRNAs) and DE‐mRNAs between hepatocellular carcinoma (HCC) and healthy controls (HC). A, Volcano plot showing DE‐lncRNAs (i) and DE‐mRNAs (ii) between HCC exosomes (exos) and HC‐exos. Red and green points represent higher and lower expression of transcription (mRNA or lncRNA) with statistical significance (fold change ≥ or ≤2.0, respectively; P ≤ .05) (X axes, fold change values; Y axes, P values). B, Hierarchical clustering of DE‐lncRNA (i) and DE‐mRNA (ii) between HCC‐exos and HC‐exos (red, high expression; blue, low expression). C, Expression levels of 6 DE‐lncRNAs (fold change ≥ 6.0; P ≤ .05) in HCC‐exos. D, Respective expression level of 5 DE‐lncRNAs in HCC cells and cell exosomes by quantitative real‐time PCR. Data are expressed as mean ± SD of 3 independent experiments. *P ≤ .05, **P ≤ .005 vs. control (7702 and 7702‐exo as control, respectively)
