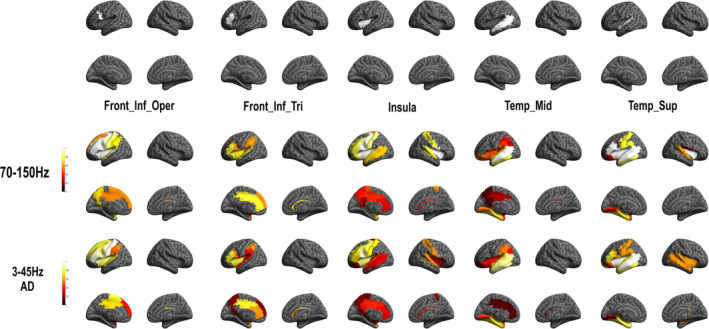
FIGURE 6.

Stereo‐electroencephalographic (SEEG) group probability map for each region of interest (ROI) for high frequency activity (HFA) (70–150) Hz and (3–45) Hz (after‐discharge [AD]). Top: anatomical location of ROI (seed) analysis and down: functional subnetwork results for each frequency band. See for probability values supplementary Table S7
