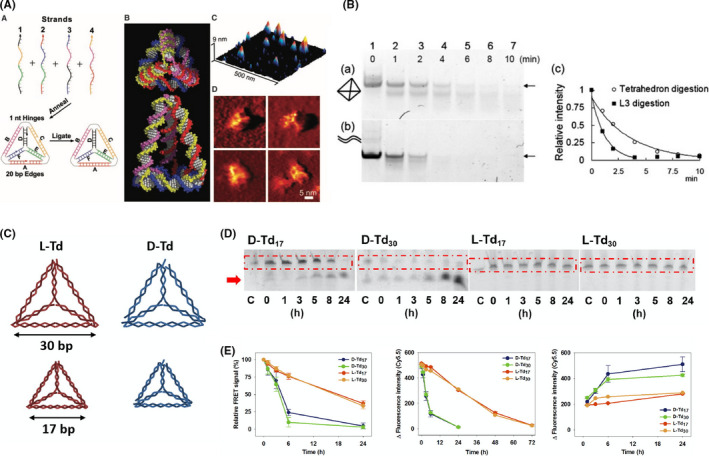
FIGURE 1.

Tetrahedral DNA nanostructure (TDN) structure and stability. A, Left panel, formation of the TDN nanostructure. Middle panel, space filling model of TDN. Right panel, atomic force microscopy images of TDN. Reproduced with permission. 13 B, In vitro stability of TDN against DNase I compared with the DNA duplex. Reproduced with permission. 28 C, L‐TDN (red) and D‐TDN (blue) in large and small size (30 bp and 17 bp, respectively). Reproduced with permission. 22 D, In vitro stability of D‐TDN and L‐TDN against serum nuclease. Reproduced with permission. 22 E, Left panel, in vivo stability of D‐TDN and L‐TDN estimated using fluorescence resonance energy transfer (FRET) signals. Middle panel, fluorescent intensity of TDN in blood samples. Right panel, fluorescent intensity of TDN in urine samples. Reproduced with permission 22
