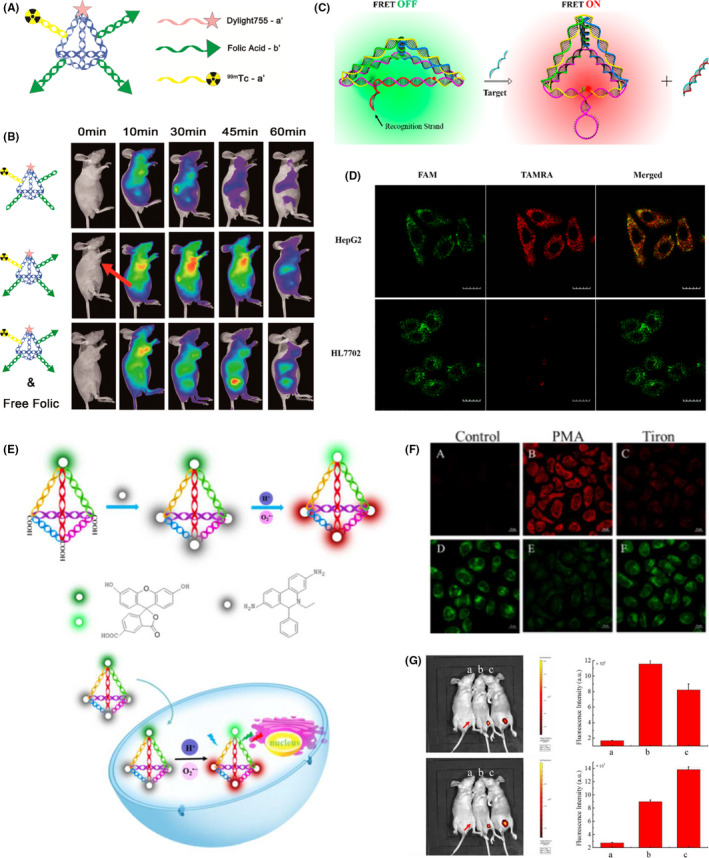
FIGURE 4.

Tetrahedral DNA nanostructures (TDN) as bioimaging platforms. A, Multiple‐armed TDN modified with Dylight 755 fluorescent dye (Dy), folic acid (FA), and radioactive isotope 99mTc for tumor‐targeting imaging. Reproduced with permission. 69 B, Fluorescent imaging of in vivo biodistribution of Dy‐99mTc‐TDN, FA‐Dy‐99mTc‐TDN, and FA‐Dy‐99mTc‐TDN and free folic acid (FA) within 1 h in KB tumor‐bearing nude mice. Coadministration of FA‐Dy‐99mTc‐TDN and free FA served as control. Reproduced with permission. 69 C, TDN‐based molecular beacon for intracellular TK1 mRNA detection. FRET, fluorescence resonance energy transfer. Reproduced with permission. 20 D, Intracellular TK1 mRNA detection in TK1‐positive HepG2 cells and TK1‐negative HL7702 cells by TDN‐based molecular beacon. Green, fluorescein (FAM, fluorescent donor); red, carboxytetramethylrhodamine (TAMRA, fluorescent acceptor). Reproduced with permission. 20 E, TDN‐based nanoprobe for simultaneous detection of pH and superoxide anion () in living cells and in vivo. Green, FAM (pH‐sensitive fluorophore); red, hydroethidine (HE, ‐sensitive fluorophore). Reproduced with permission. 18 F, Simultaneous intracellular imaging of and pH in HeLa cells by TDN‐based nanoprobe. a, d, Control. b, e, Phorbol myristate acetate (PMA) induced production treated cells before incubated with TDN nanoprobe. c, f, Tiron, scavenger, treated cells after PMA treatment. a‐f, All conditions were excited at 488 nm. a‐c, Emission wavelength was collected at 560‐630 nm (HE channel, red). d‐f, Emission wavelength was collected at 500‐540 nm (FAM channel, green). Reproduced with permission. 18 G, In vivo fluorescence imaging of and pH in lipopolysaccharide (LPS)‐induced inflammatory mice model. a, Control (LPS alone). b, TDN nanoprobe injection. c, TDN nanoprobe injection after LPS treatment. a, Emission wavelength collected at 500‐540 nm (FAM channel) after excitation at 480 nm. c, Emission wavelength collected at 580‐620 nm (HE channel) after excitation at 480 nm. b, d, Quantification of fluorescence intensity from (a) and (c). Reproduced with permission 18
