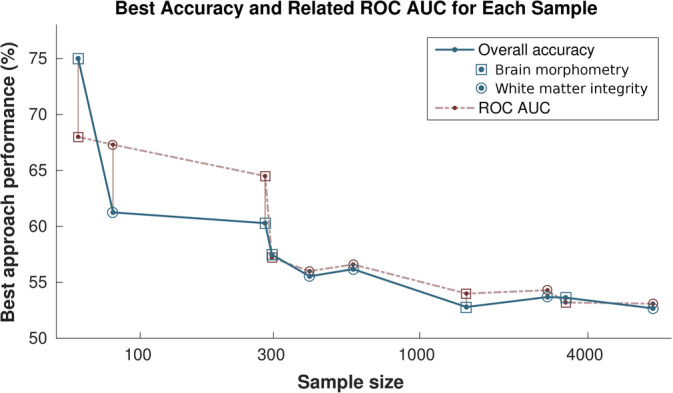
FIGURE 2.

Best classification accuracies plotted against sample sizes for all 10 analysed samples (five diagnostic definitions across two feature domains—brain morphometry and white matter integrity). Best accuracy tended to decrease towards chance level with increasing sample size. Sample size/abscissa axis logarithmically scaled. Abbreviation: ROC AUC, receiver operating characteristic area under the curve
