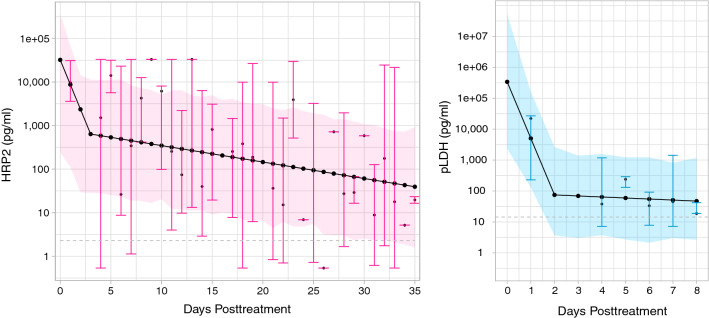
Fig. 5.
Biphasic exponential decay models for HRP2 and pLDH post-treatment. Fitted population-level biphasic decay models, with a switch time (knot) of 3 days post-treatment for HRP2 (pink) and 2 days post-treatment for pLDH (blue). Black dots indicate median model predictions, with shaded regions showing associated 95% prediction intervals. Median antigen concentrations with 95% CIs, depicted by pink and blue vertical lines, are also plotted for each day data were available post-treatment. Horizontal grey lines indicate the lower LOQ for each antigen—values below the LOQ were set to half this LOQ and retained in the analyses. Samples with evidence of recurrent P. falciparum parasitemia by microscopy at any point in the follow-up window after 1 day post-treatment were excluded. HRP2, histidine rich protein 2; pLDH, Plasmodium lactate dehydrogenase

