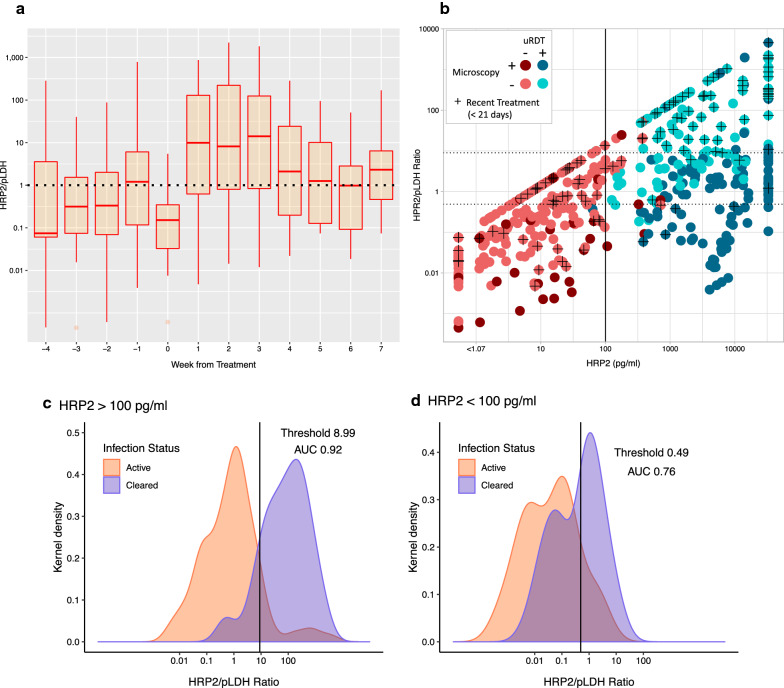
Fig. 6.
HRP2:pLDH ratios as tool to predict infection status. a Boxplot of HRP2:pLDH ratios for individuals within 4 weeks pretreatment to 7 weeks post-treatment (n = 311). b Scatterplot of the relationship between HRP2:pLDH vs. HRP2. c Density plot of HRP2:pLDH ratios for individuals with active vs. cleared P. falciparum infection and HRP2 > 100 pg/mL. With a cutoff of 8.99 HRP2:pLDH ratio, cleared infection is predicted with sensitivity = 88.9%, specificity = 89.7%, and AUC = 0.92. d Density plot of HRP2:pLDH ratios for individuals with active vs. cleared infection and HRP2 ≤ 100 pg/mL. With a cutoff of 0.49 HRP2/pLDH ratio, cleared infection is predicted with sensitivity = 64.1%, specificity = 85.7%, and AUC = 0.77. AUC, area under the curve; HRP2, histidine rich protein 2; pLDH, Plasmodium lactate dehydrogenase

