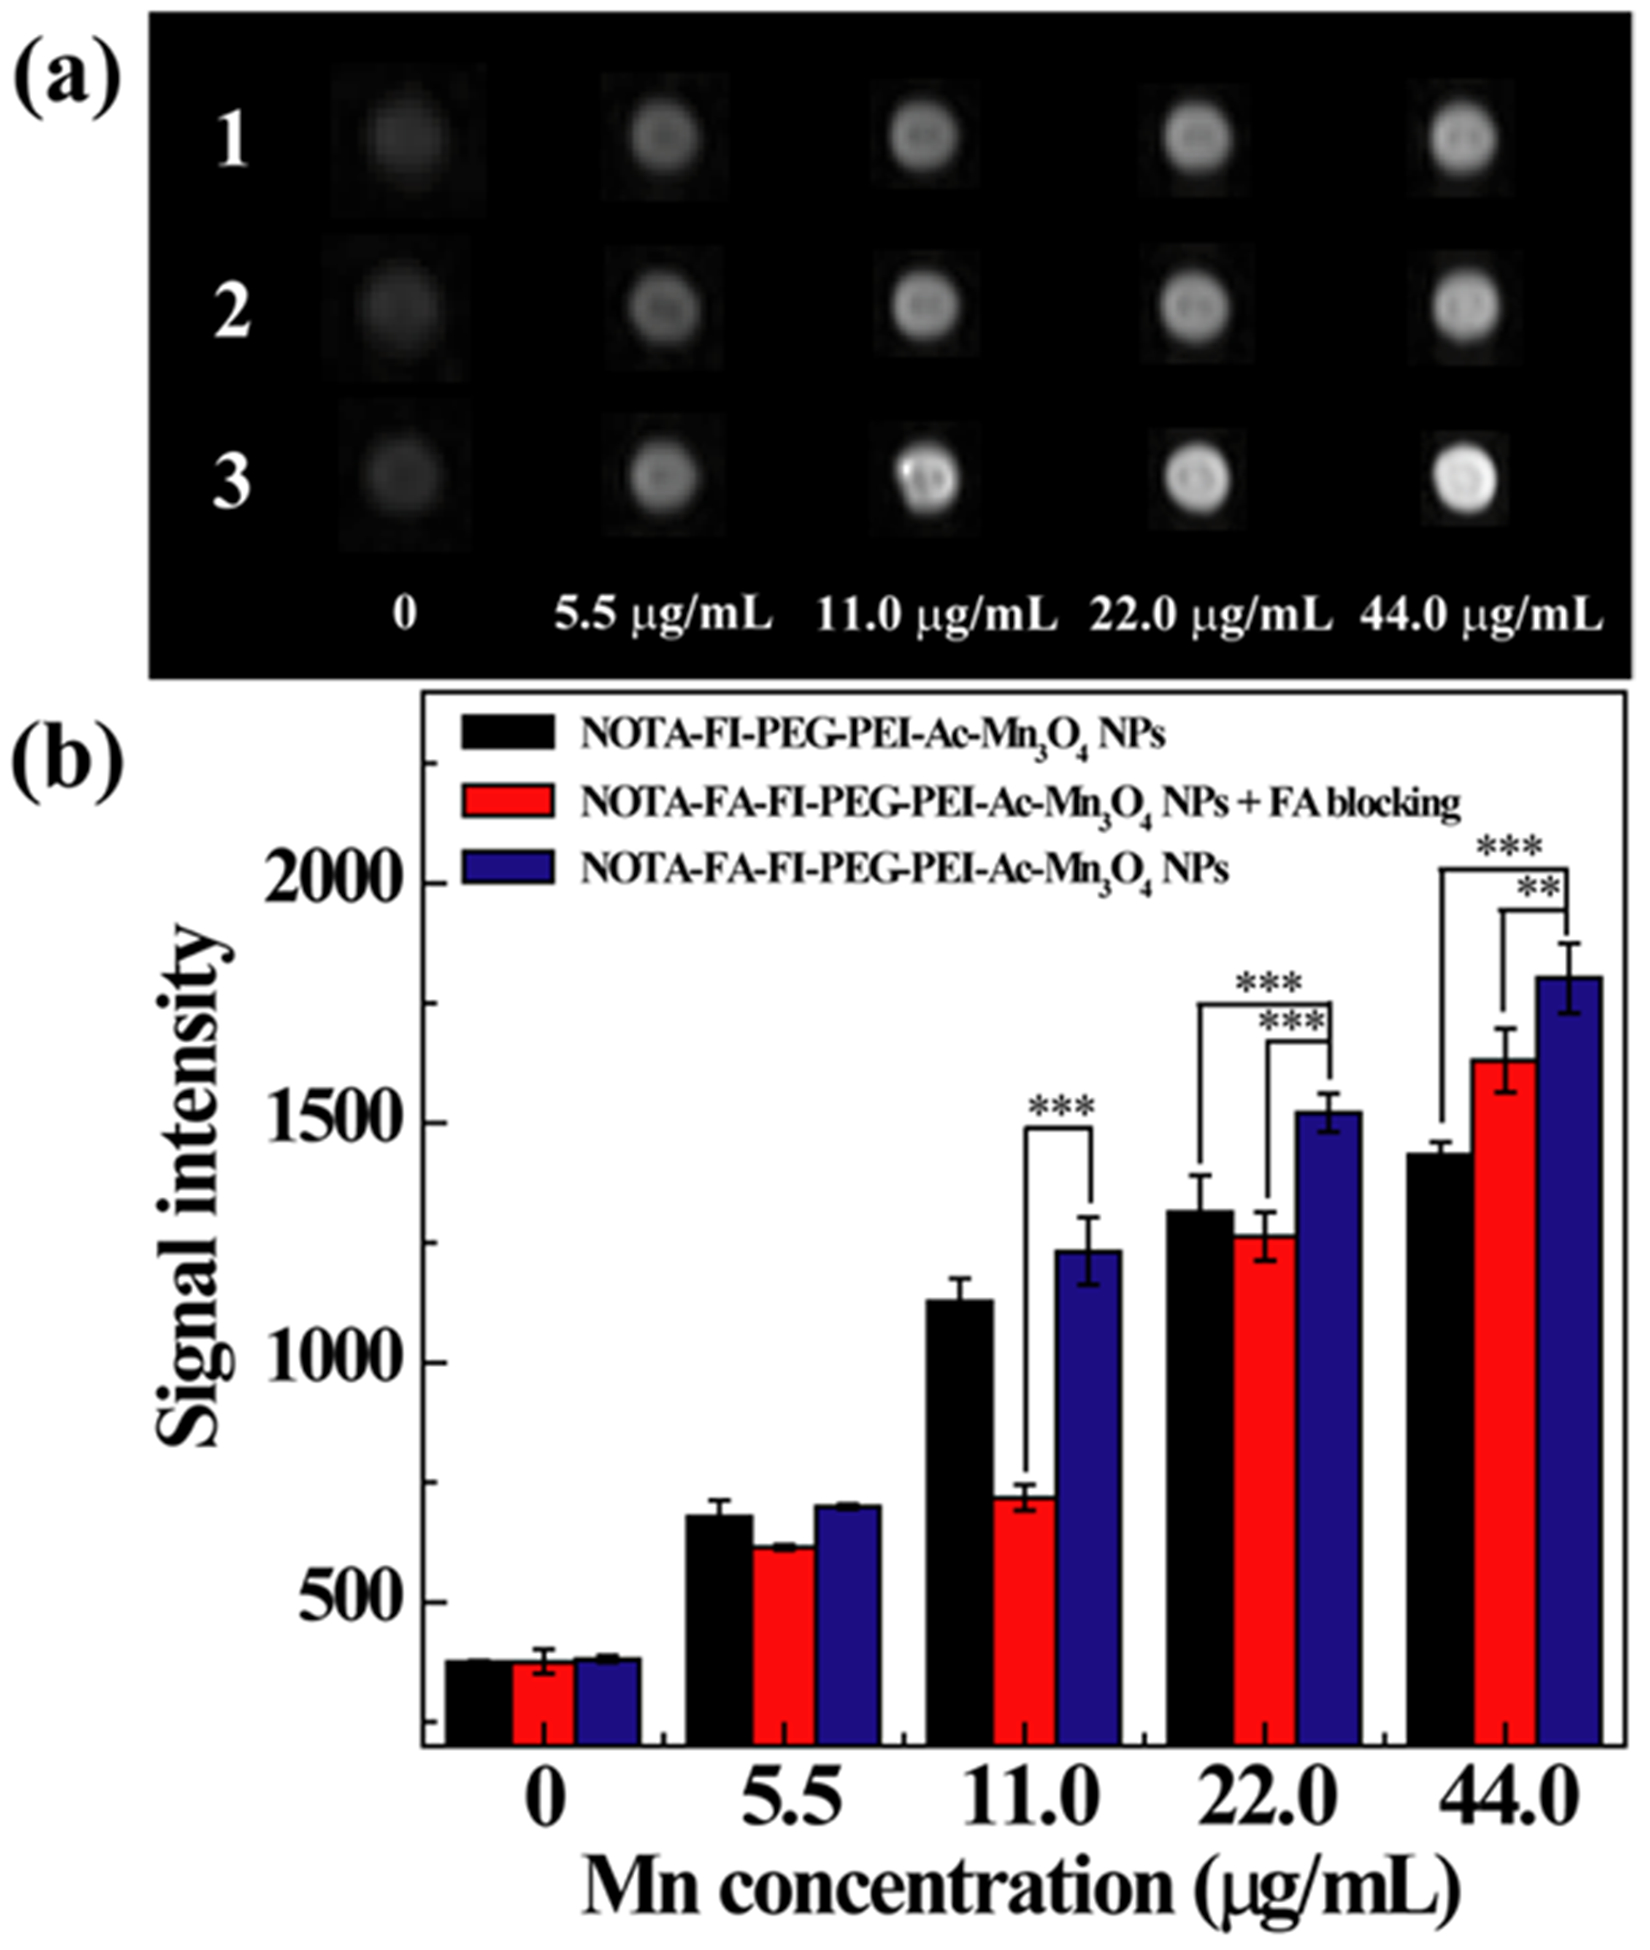
Figure 6.

(a) T1-weighted MR images of FR-blocked HeLa cell suspensions (1), HeLa cell suspensions (3) incubated with the NOTA–FA–FI–PEG–PEI–Ac–Mn3O4 NPs, and HeLa cell suspensions incubated with the NOTA–FI–PEG–PEI–Ac–Mn3O4 NPs (2) at various Mn concentrations for 4 h. (b) The quantitative MR signal intensity of the FR-blocked HeLa cell and HeLa cell suspensions as a function of Mn concentration.
