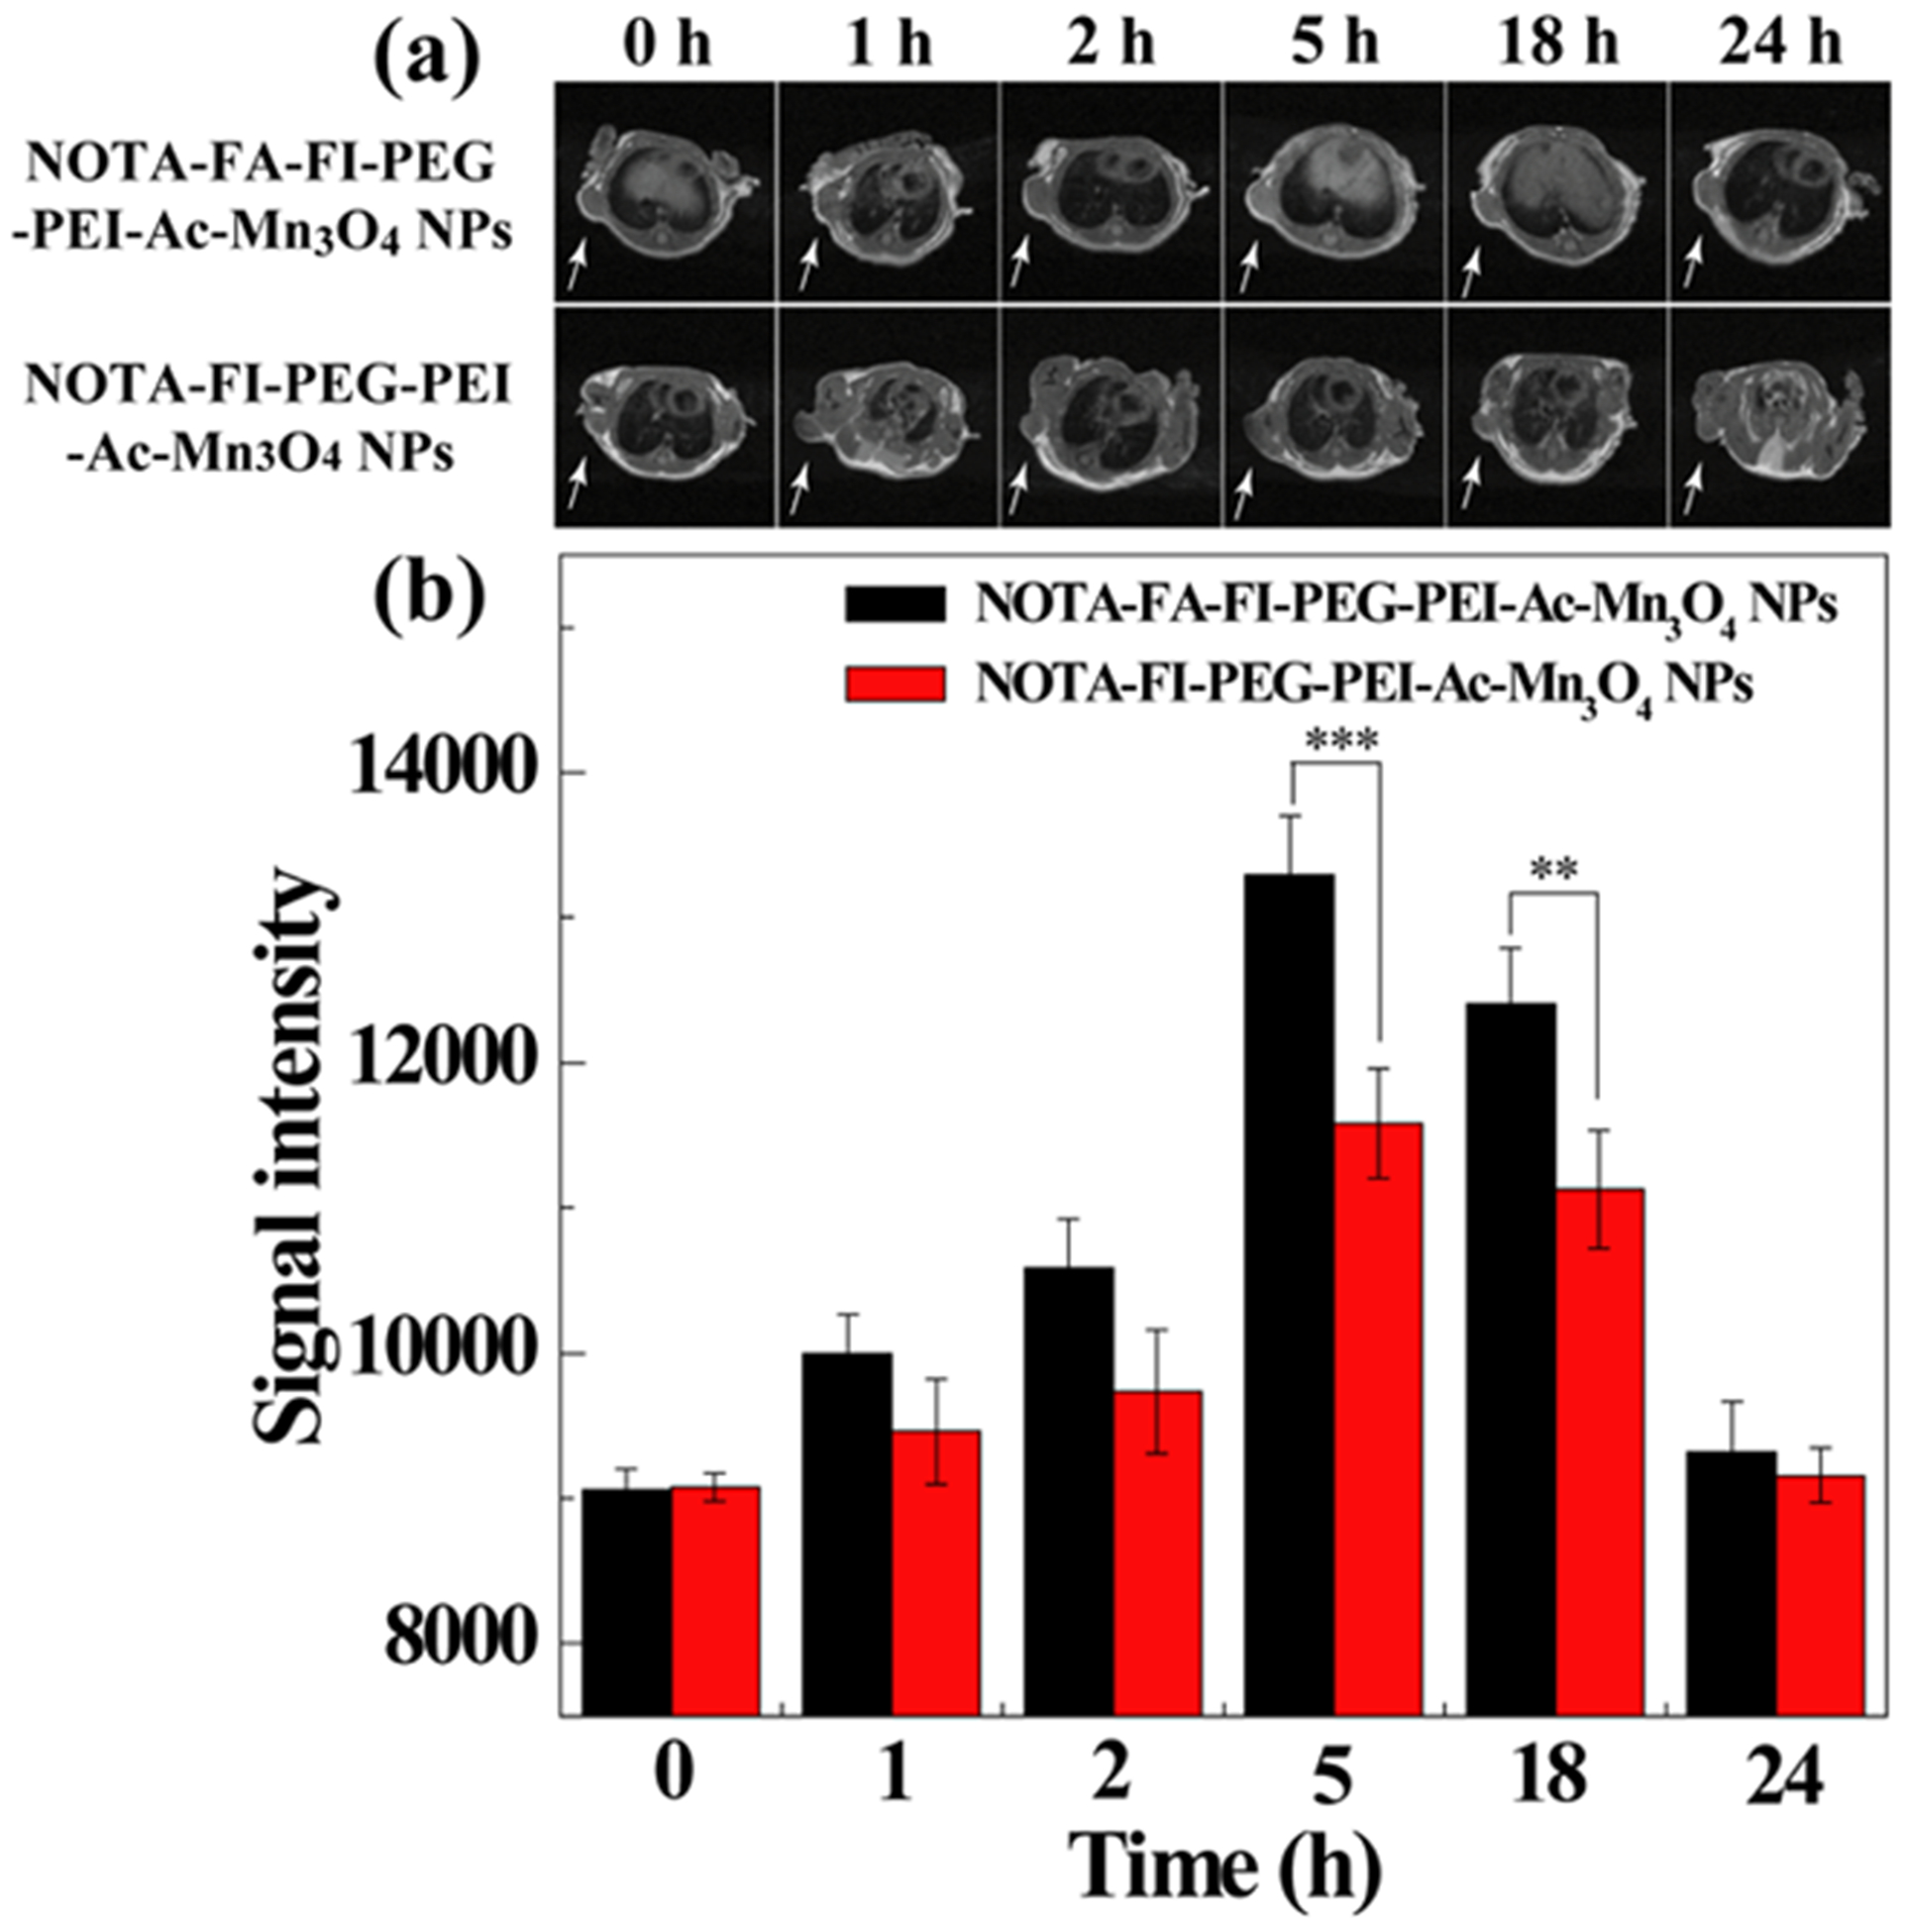
Figure 7.

In vivo T1-weighted MR images (a) and signal intensity (b) of HeLa tumors after intravenous injection of the NOTA–FA–FI–PEG–PEI–Ac–Mn3O4 NPs or the NOTA–FI–PEG–PEI–Ac–Mn3O4 NPs (500 mg Mn, in 0.2 mL saline) at different time points. Tumors are indicated by white arrows.
