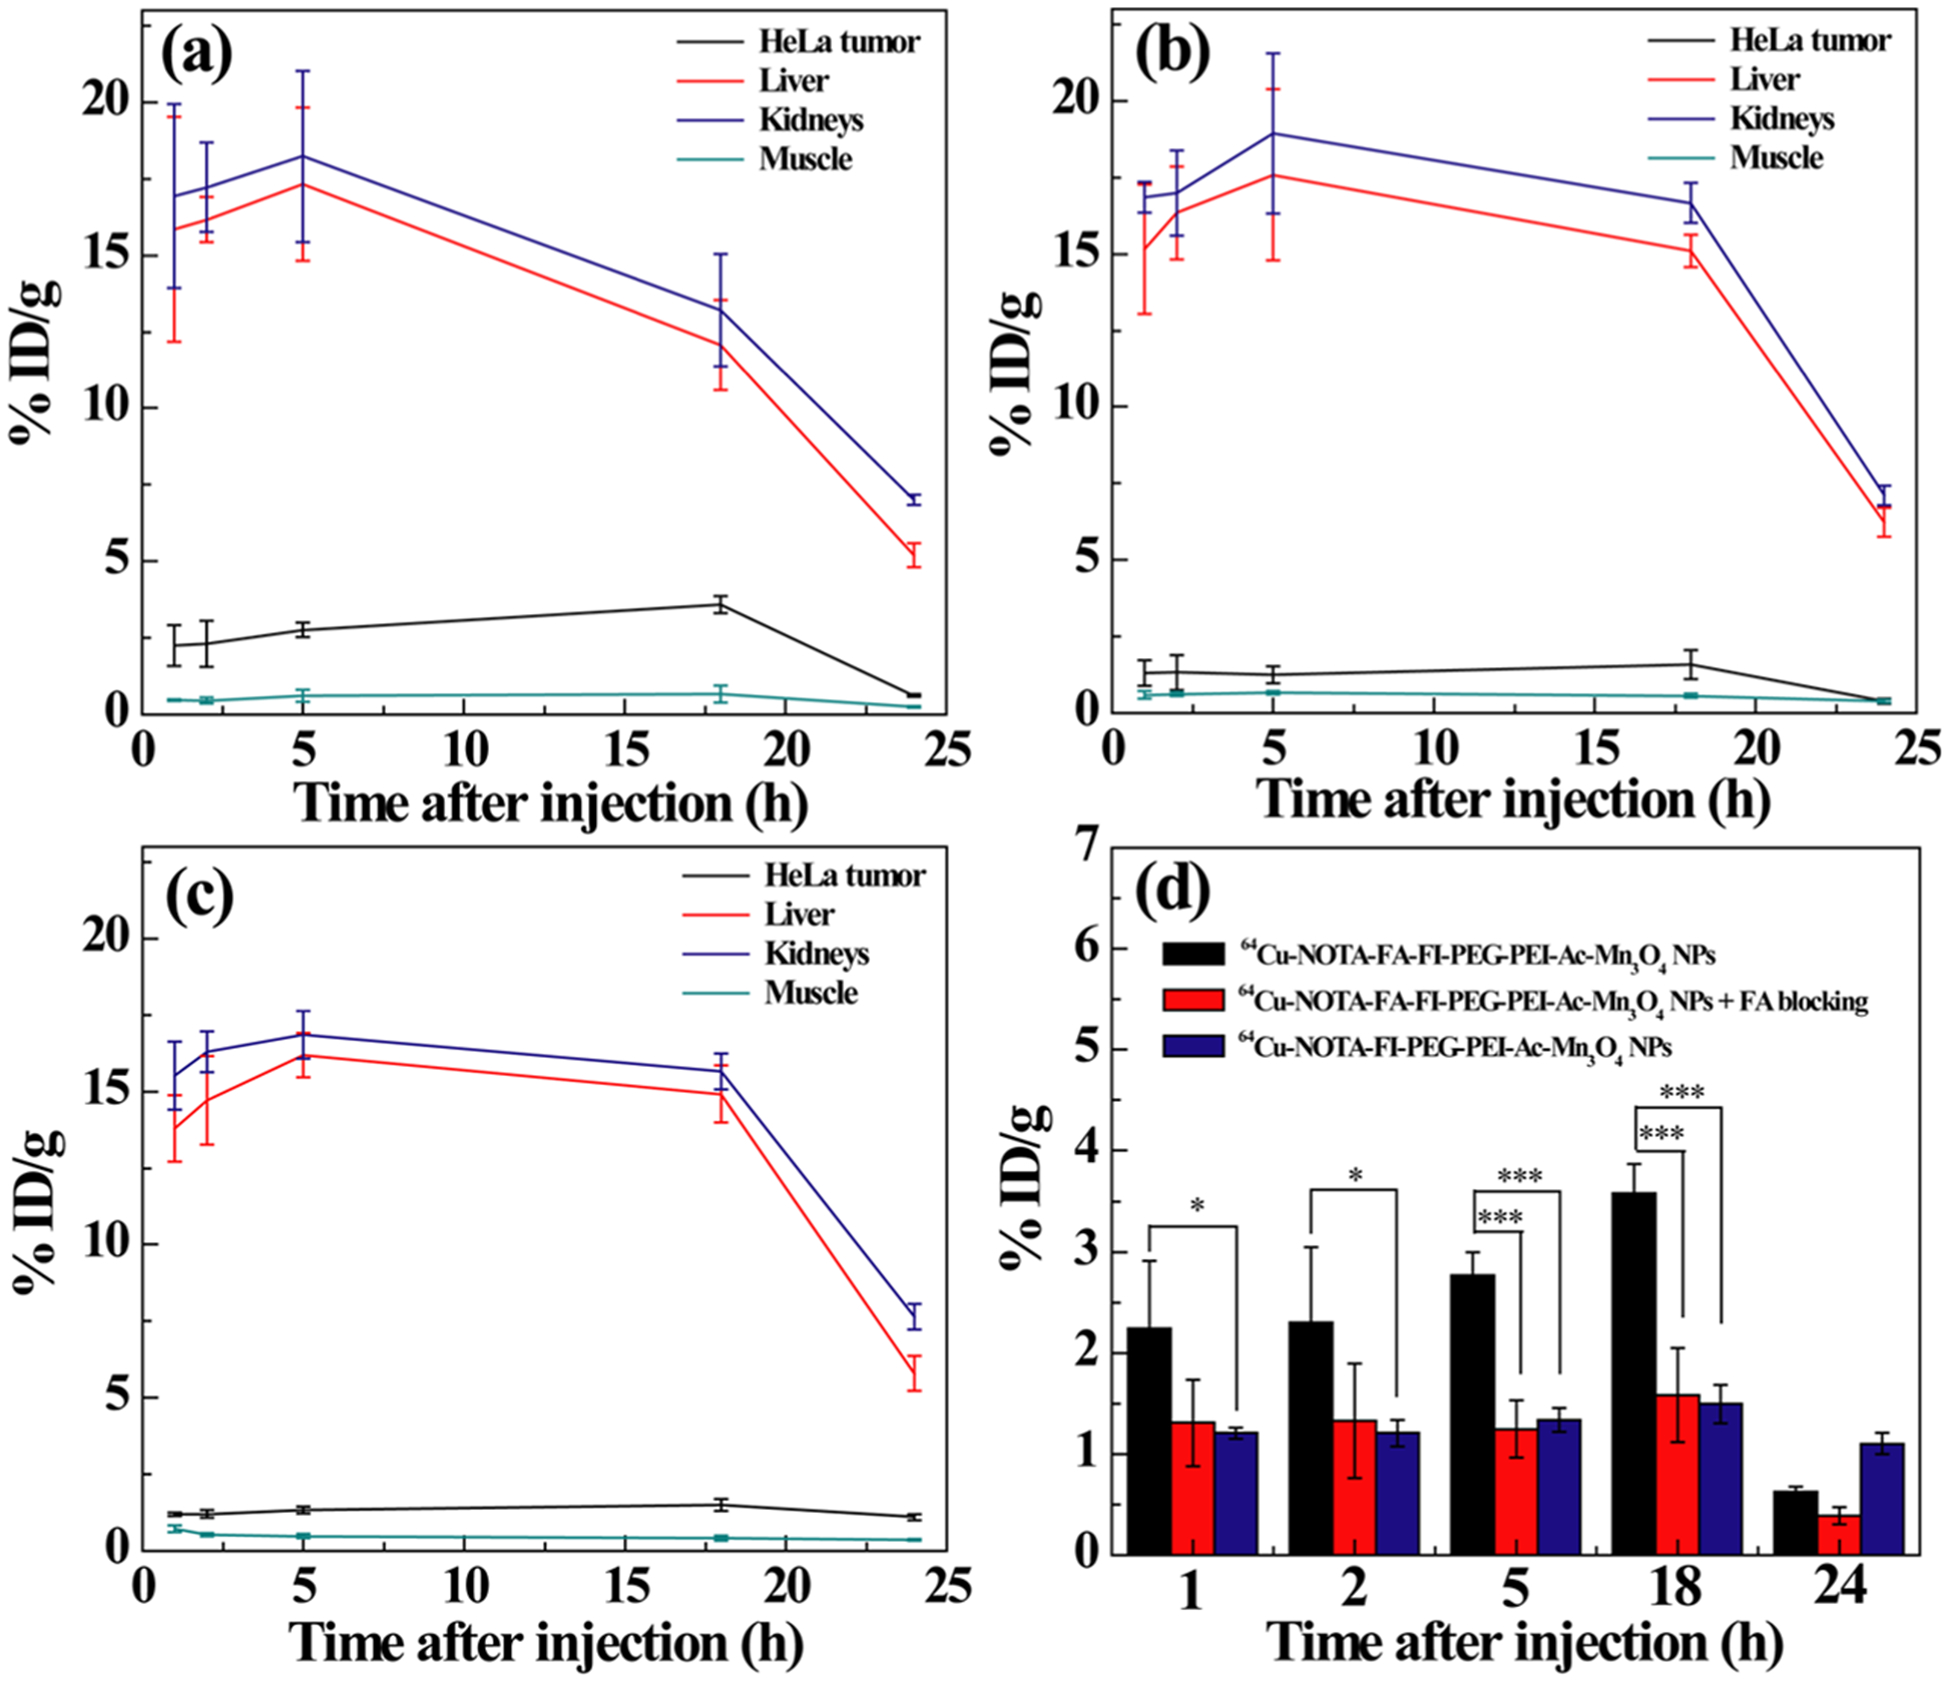
Figure 9.

Time–activity curves of tumor, liver, kidneys, and muscle from quantitative microPET imaging analysis of (a) the 64Cu–NOTA–FA–FI–PEG–PEI–Ac–Mn3O4 NPs in the HeLa tumor model, (b) the 64Cu–NOTA–FA–FI–PEG–PEI–Ac–Mn3O4 NPs in the FR-blocked HeLa tumor model, and (c) the 64Cu–NOTA–FI–PEG–PEI–Ac–Mn3O4 NPs in HeLa tumor. (d) Quantitative microPET imaging analysis of tumor uptake of the 64Cu-labeled NPs at different time points postinjection.
