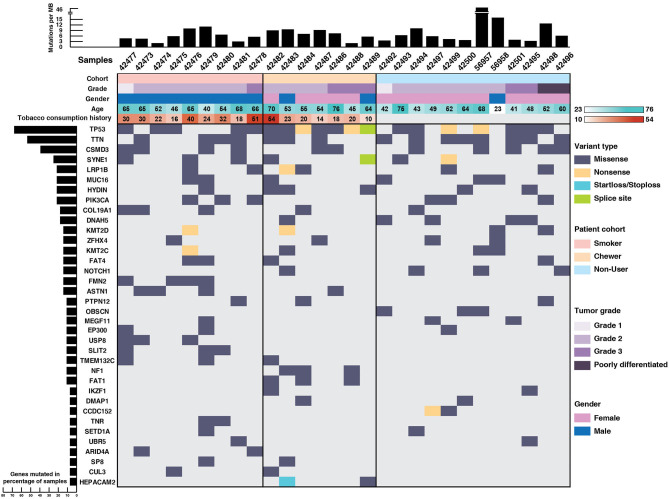
Figure 1.
Mutational landscape of esophageal squamous cell carcinoma. Top panel depicts mutation load per Mb, middle panel depicts sample details including tumor grade, gender, age, and tobacco consumption history. Each column represents a sample and each row depicts a gene. Somatic mutations are colored based on mutation type and left panel depicts percentage of samples that harbor mutations.

