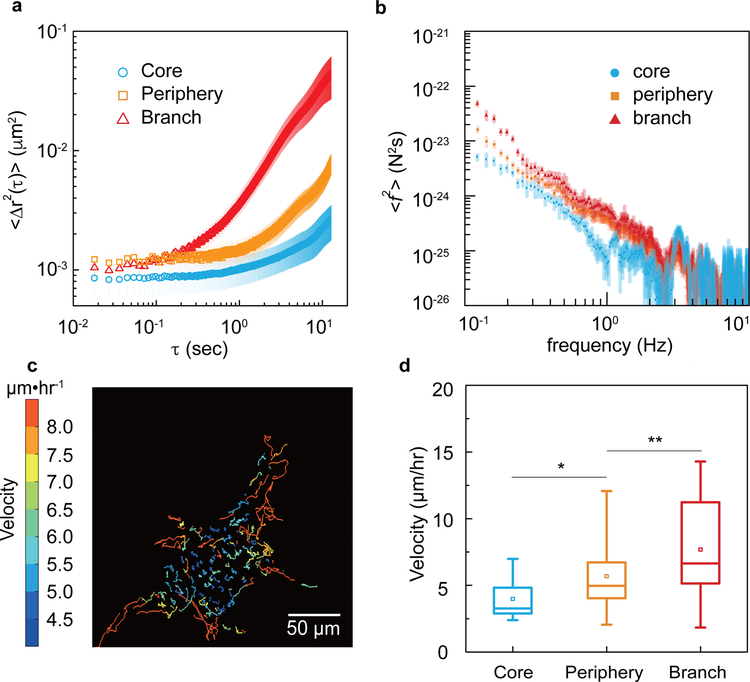
Figure 2. Different cell subpopulations in a cancer organoid show distinct dynamic behaviors.
a, Two dimensional time- and ensemble-averaged MSD, <Δr2(τ)>, of 0.5-μm-diameter particles are plotted against lag time on a log-log scale, in the cytoplasm of cells in core (blue circles), periphery (orange squares) and branch (red triangles) regions of the cancer organoid. The data is averaged from 15 independent measurements and the error bars stand for standard deviation. b, Cytoplasmic force spectrum calculated from spontaneous fluctuations of tracer particles and the active microrheology measurements, through <f2(ω)>=|K(ω)|2<r2(ω)> inside cells at different locations of the cancer organoid. Data are shown as mean ± standard deviation. (n>10). c, Cell migratory trajectories over 4 hours reveal a highly dynamic scenario of cell migration within the central 20-μm cross-section of the cancer organoid. The color stands for the average migratory speed of each cell. d, The migratory speed of cells in each subpopulations are plotted. *P<0.05; **P < 0.01; ***P<0.001.

