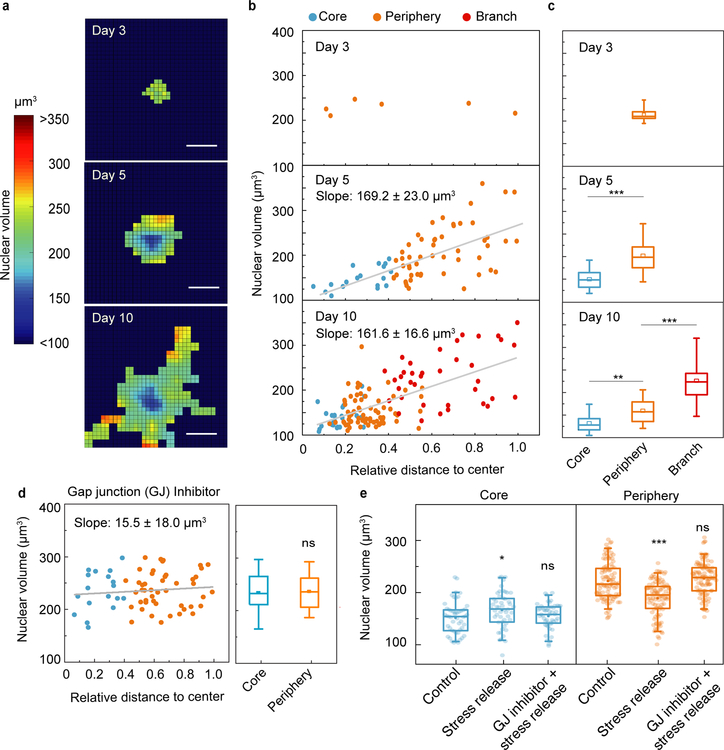
Figure 3. Temporal and spatial evolution of cell volume during the growth of cancer organoids.
a, Nuclear volume heat map shows the evolution of cell nuclear volume distribution in the developing cancer organoid. b, Nuclear volume of every individual cell in the cancer organoid is plotted against relative distance to the organoid center at different stages, showing a strong correlation between nuclear volume and spatial position, especially at middle and later stages. c, Nuclear volume of cells in different geometrical regimes of the cancer organoids (n>3). d, Nuclear volume of individual cells in GJ-inhibited cancer organoids. e, Stress release changes the distribution of individual nuclear volumes in the core and periphery if GJ are intact. Scale bars in a represent 50 μm. *P<0.05; **P < 0.01; ***P<0.001.

