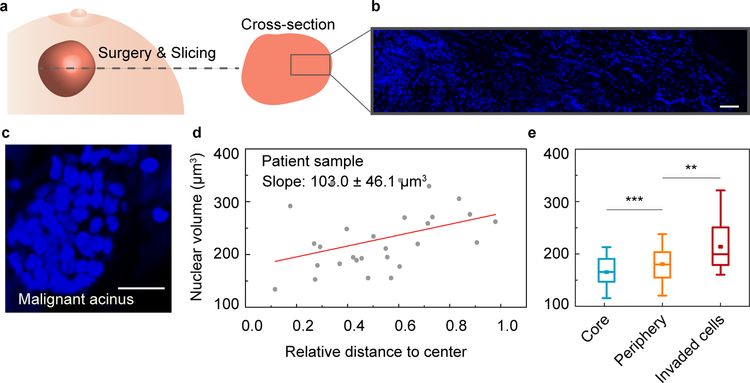
Figure 4. Characterization of cell volume heterogeneity in patient samples.
a, Schematic of a tumor biopsy from breast cancer patient. b, Large-scale fluorescent image showing cell nuclei from core to edge area of the biopsy. c, Invasive acinar structures within the biopsy. d, Individual cell nuclear volume is plotted against its relative distance to the center of the invasive acinar structure. e, Nuclear volume of cells in different geometrical regimes of the invasive acinar structures (n=3). Scale bars in b and c represent 50 and 20 μm, respectively. *P<0.05; **P < 0.01; ***P<0.001.

