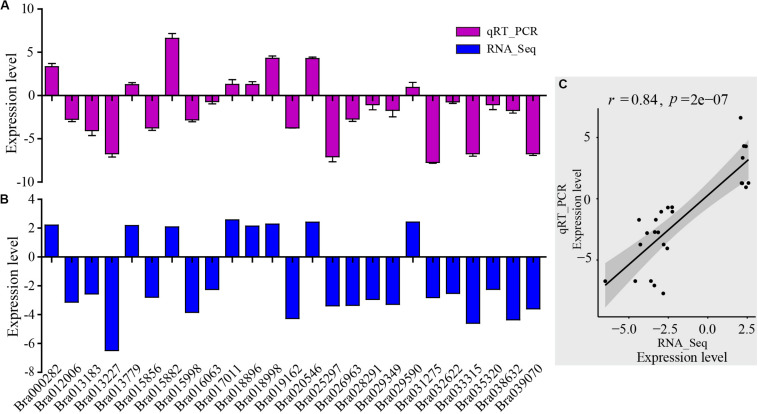
FIGURE 3.
Validation of RNA-Seq results by qRT-PCR. (A) qRT-PCR expression levels were determined based on the blue bar. (B) RNA-Seq expression levels were determined based on the purple bar. (C) Scatter plots of correlation test between qRT-PCR and RNA-Seq results. r is Pearson correlation coefficient. The p-value is the significance level of the correlation. There were 25 genes randomly selected from the DEGs related to AP2-EREBP transcription factors, basic helix-loop-helix (bHLH) transcription factors, chloroplast and mitochondria gene families, cytochrome P450, MAP kinase (MAPK) families, MYB gene families, NAC transcription factor family, and WRKY transcription factor family.

