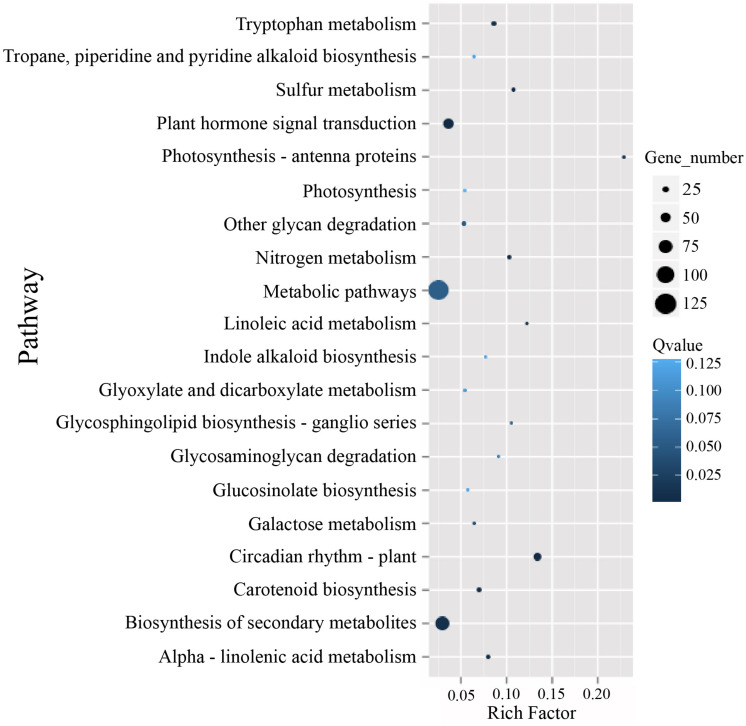
FIGURE 5.
The KEGG enrichment scatterplot of the top 20 statistically significant pathways plotted for the DEGs. The rich factor on the horizontal refers to the ratio between the gene numbers of DEGs which are located at the pathway entry as well as the total gene numbers of all annotated genes which are located at the pathway entry. Q-value was determined by multiple hypothesis testing corrections, and their values vary from 0 to 1.

