FIGURE 6.
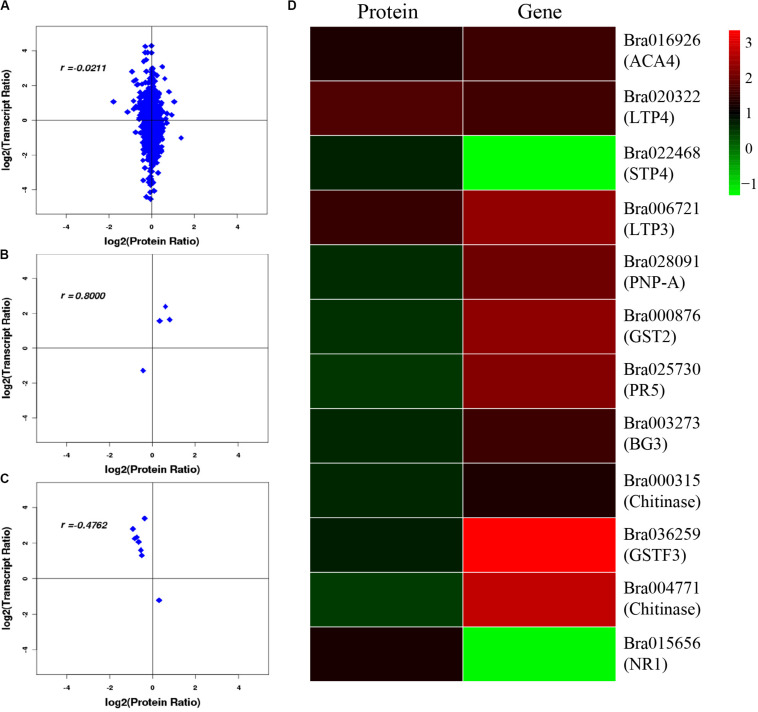
Correlation analysis between transcriptome and proteome. (A) Correlation analysis of all DEGs and DEPs. (B) Correlation analysis of DEGs and DEPs with similar changing trends. (C) Correlation analysis of DEGs and DEPs with opposite changing trends. (D) Heatmap for 12 pairs of DEGs and DEPs. Red represents upregulated genes and green represents downregulated genes. Gene ID and gene names were attached on the right. ACA4: Autoinhibited Ca(2+)-atpase, isoform 4, LTP4: Lipid transfer protein 4, STP4: Sugar transporter 4, LTP3: Lipid transfer protein 3, PNP-A: Plant natriuretic peptide A, GST2: Glutathione s-transferase phi 2, PR5: Pathogenesis-related protein 5, PR2/BG2: Pathogenesis-related protein 2/beta-1,3-glucanase 2, Chitinase: Chitinase family protein, GSTF3: Glutathione s-transferase f3, Chitinase: Chitinase, NR1: Nitrate reductase 1. For the correlation analysis diagram (B–D), the levels of the DEPs were labeled on the horizontal axis, and the levels of the DEGs were labeled on the vertical.

