Figure 1.

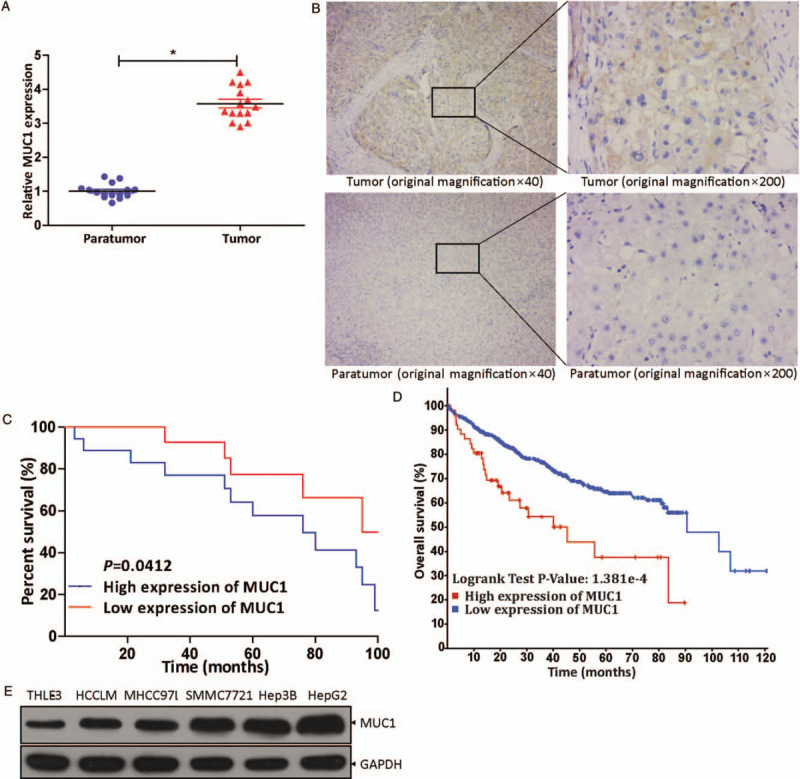
The expression of MUC1 in vivo and in vitro and its impact on overall patient survival. (A) qRT-PCR revealed MUC1 levels in HCC tissues (n = 15) and corresponding paratumor tissues (n = 15). ∗P < 0.001 compared with paratumor tissues. (B) MUC1 levels were examined in tissue samples (n = 30) by immunohistochemical staining assay (original magnification ×40 or ×200). (C) Analysis by Kaplan-Meier survival curves for the relationship between overall survival rate of patients and MUC1 expression level (P = 0.0412). (D) Analysis for the correlation between MUC1 expression level in HCC and overall survival rate of patients in the TCGA database. (E) The expression level of MUC1 in HCCLM, MHCC97L, SMMC7721, Hep3B, and HepG2 was examined by Western blot, with THLE-3 cells as control. HCC: Hepatocellular carcinoma; MUC1: Mucin 1; qRT-PCR: Quantitative real-time polymerase chain reaction.
