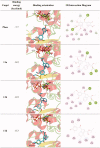
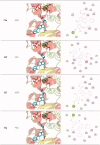
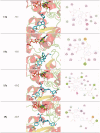
Table 3.
Binding orientation, energy, and amino acid contacts for tested compounds, as predicted by molecular docking experiments.
 | |
 | |
 |
For binding orientation, the α,β-tubulin heterodimer is shown as ribbons; aminoacids and ligands are represented as sticks; for 2D interaction diagrams, colours are as follows: conventional hydrogen bonds – green, carbon–hydrogen bonds – pale green; hydrophobic interactions – light pink; amide–π stacking – dark pink; anion–π stacking: orange; π–sulphur stacking: dark yellow.
