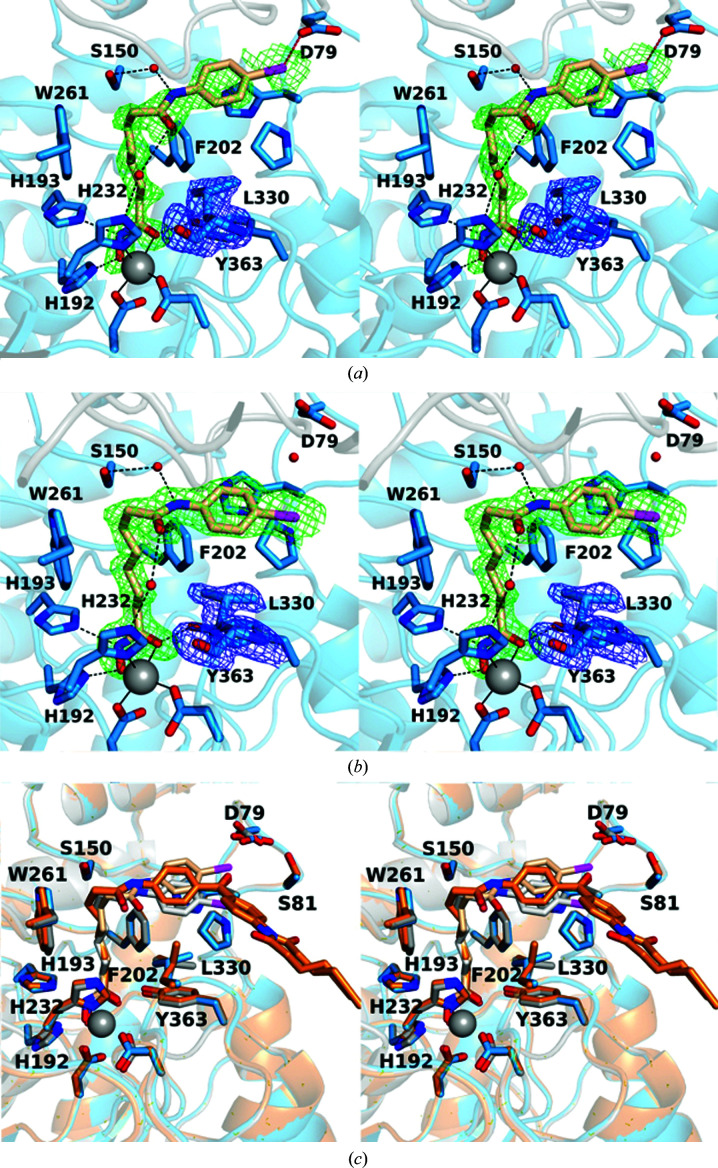
Figure 4.
Stereoviews of the K330L HDAC6 CD1–4-iodo-SAHA complex (PDB entry 6wyq). (a) Polder OMIT maps showing 4-iodo-SAHA bound to monomer A and Leu330 (each contoured at 2.5σ). Atoms are color-coded as follows: C, light blue (monomer A), light gray (monomer B) or wheat (inhibitor); N, blue; O, red; I−, magenta; Zn2+, gray sphere; solvent, small red spheres. Metal-coordination and hydrogen-bond interactions are indicated by solid and dashed black lines, respectively. The halogen bond between the inhibitor I atom and Asp79 is indicated by a dashed magenta line. (b) Polder OMIT maps showing 4-iodo-SAHA bound to monomer B (contoured at 3.5σ) and Leu330 (contoured at 3.0σ). Atoms are color-coded as in (a), except that C atoms are in light blue for monomer B and light gray for monomer A. (c) Superposition of the K330L HDAC6 CD1 complexes with 4-iodo-SAHA (monomer A and inhibitor are in blue and wheat, respectively; monomer B and inhibitor are in gray and light gray, respectively) and SAHA-BPyne (protein and inhibitor are in orange and dark orange, respectively) reveal that the SAHA moieties of each inhibitor bind with generally similar conformations, with slight variations in capping-group conformations.

