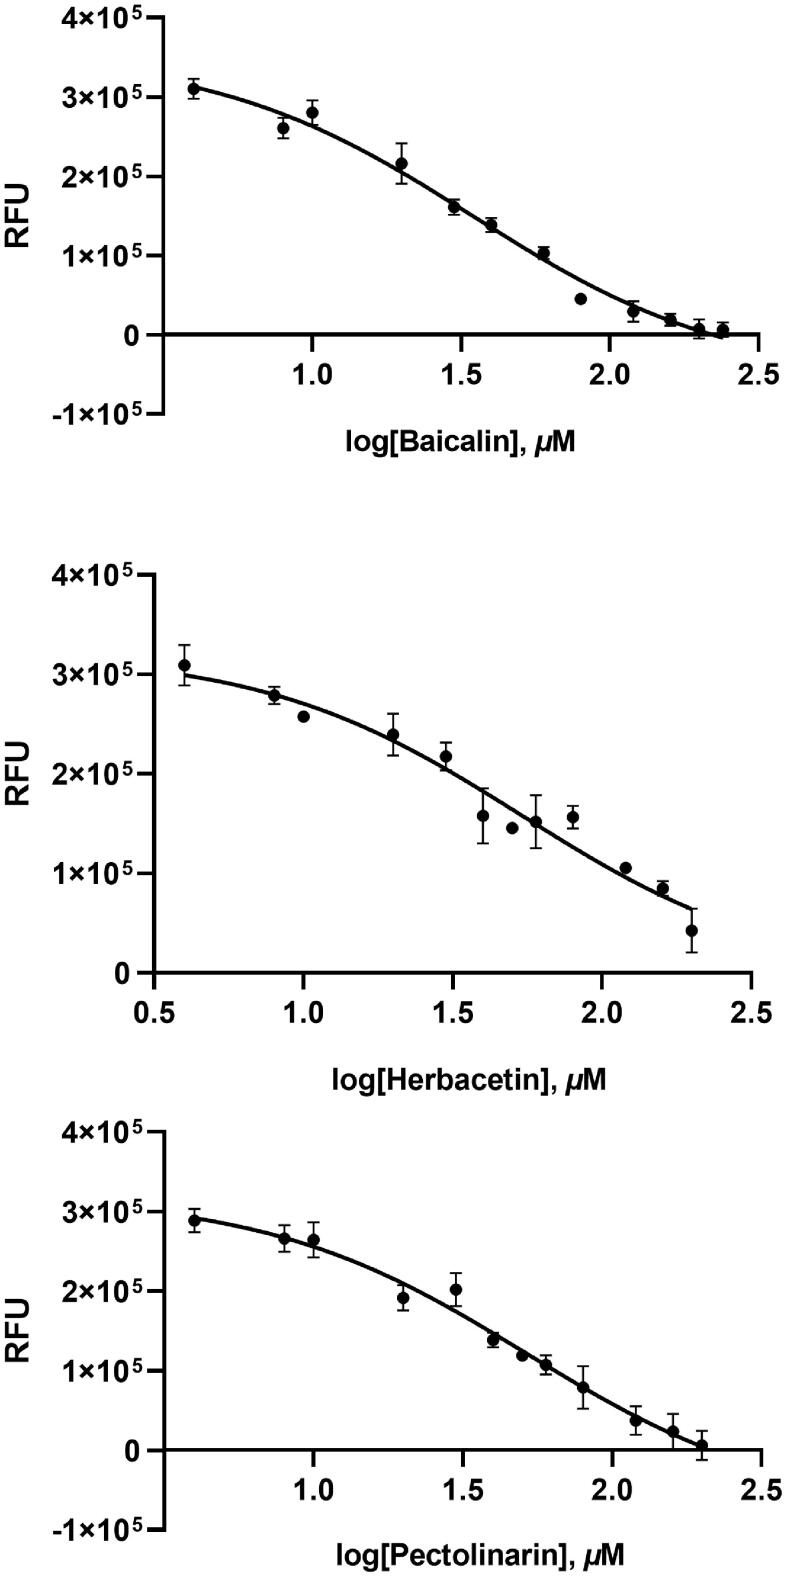
Figure 2.
Results from the FRET method. Each data point represents the effect of each inhibitory compound against SARS-CoV-2 3CLpro compared to the control. The RFU are plotted against the log-concentration of inhibitory compounds. Each dot is expressed as the mean ± standard error of the mean (n = 3). RFU: relative fluorescence units.

