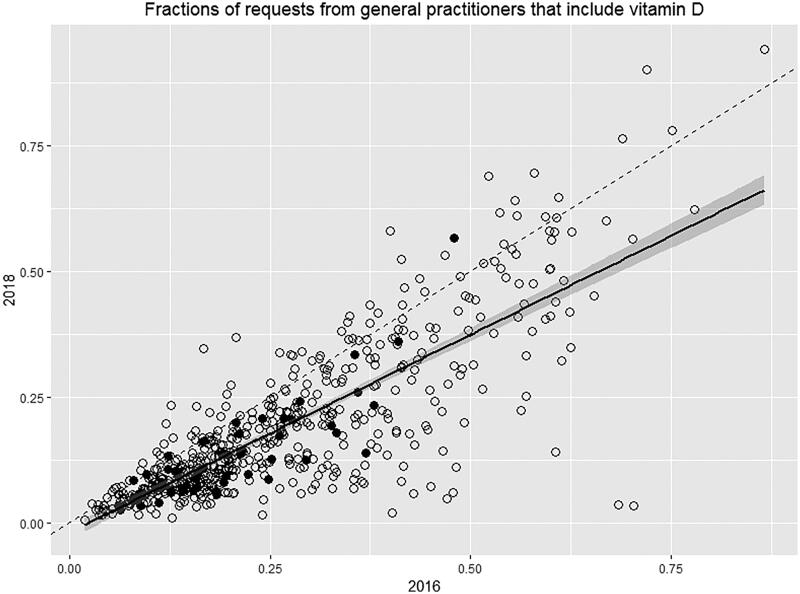
Figure 1.
Correlation between the fraction of request forms from general practitioners with a request of vitamin D in 2016 (x-axis) compared with 2018 (y-axis). Each symbol is one general practitioner. Solid symbols represent the 10% of general practitioners with the highest total number of requisitions. The dashed line represents the line of no change. The solid line represents the correlation between 2016 and 2018. The grey area represents ± 1 SD.

