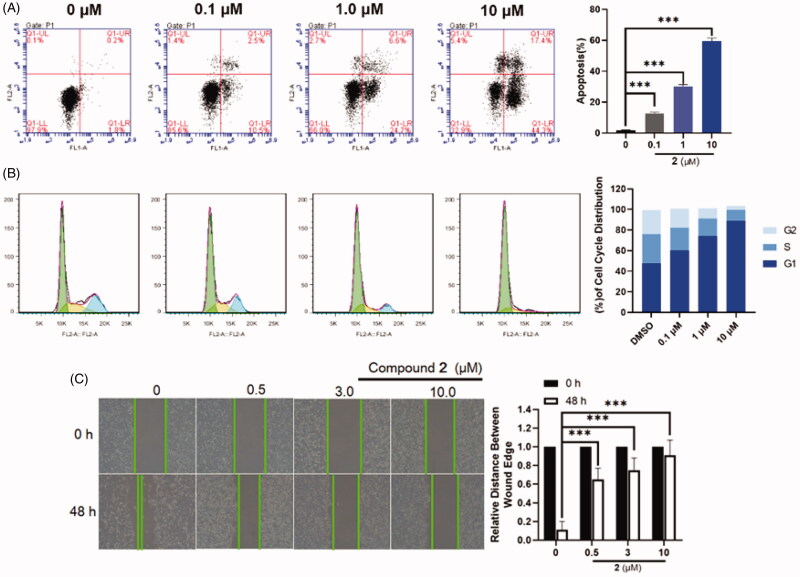
Figure 5.
(A) Flow cytometry analysis of apoptosis induction by compound 2 in SW620 cells at the indicated concentrations for 24 h. Data are expressed as mean ± SD of three independent experiments. Significant differences between each of the indicated groups were determined using the Student’s t test. p < 0.001 (***). (B) Effects of compound 2 on cell cycle arrest at the indicated concentrations for 48 h. Data are obtained through three independent experiments. (C) SW620 cells were treated with compound 2 (0–10.0 μM) for 48 h. Afterwards, photographs were captured, these results are summarised in right. Data are expressed as mean ± SD of three independent experiments. Significant differences between each of the indicated groups were determined using the Student’s t test. p < 0.001 (***).

