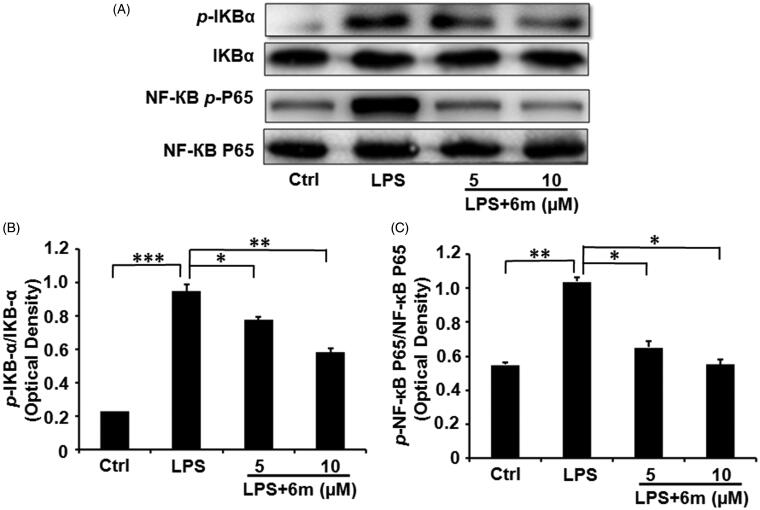
Figure 6.
(A) The inhibitory effects of 6 m on phosphorylation of IκBα and p65 in LPS-stimulated BV2 microglia cells. (B) The relative expression of p-IκB-α and IκB-α. (C) The relative expression of p-NF-κB and p65/NF-κB p65. Statistical significance is indicated: *p < .05, **p < .01, ***p < .01 versus LPS group (one-way ANOVA followed by Dunnett’s test). The data are representative of three independent experiments.

