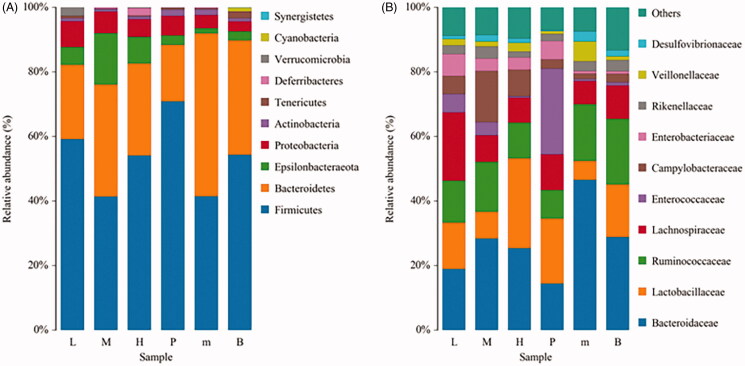
Figure 7.
Analysis of the abundance of bacteria in chicken faeces. (A) In the phylum level; (B) In the family level. ‘B’ represented the normal group; ‘m’ represented the untreated group; Chickens in the group P were administrated with qiuliling at the dosage of 10 g/kg/d; Chickens in the FMTE-treated groups (L, M and H) were administrated with FMTE at the dosage of 2.5, 5, and 10 g/kg/d, respectively, through mixing with feed. The same colour in each diagram represented the same bacteria, and different areas represented different proportions.

