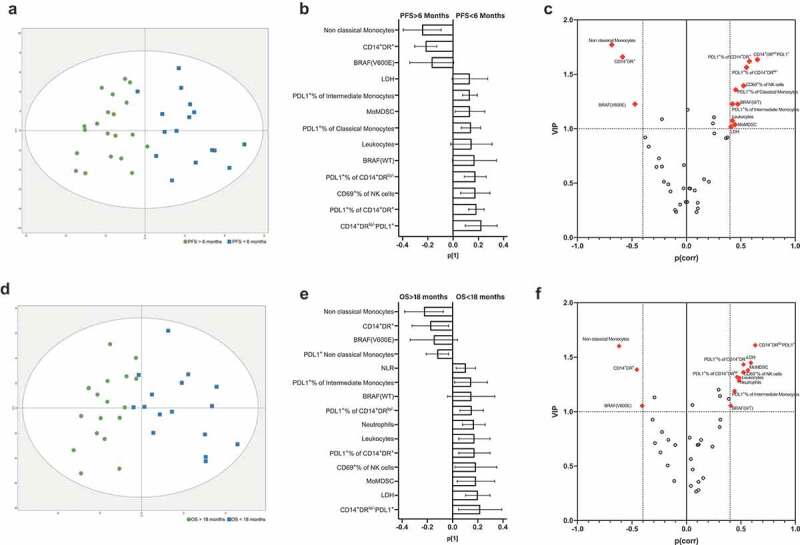
Figure 1.

Discriminant analysis of melanoma patients (n = 36) treated with PD-1 checkpoint inhibitors at baseline. (a) Discriminant analysis related to PFS: green squares, PFS >6 months, blue squares, PFS <6 months. The horizontal axis represents the predictive, the vertical axis represents the orthogonal component. Ellipse Hotelling’s T2 95% confidence interval limit. (b) Loadings plot with the 14 most relevant variables correlated with PFS. Error bars represent jack-knifed 95% confidence intervals. Positive correlation to long PFS means negative correlation to short PFS, and vice versa. (c) Combined plot showing the scaled loadings (p(corr)[1]) and the variable importance in the projections (VIP) according to PFS; dashed lines mark VIP values = 1.0, and |p(corr[1])| = 0.4, which were used as cutoff points for biomarker selection. Panels d–f show the discriminant analysis (d), loadings (e) and p(corr)[1]/VIP plot (f) when OS (long vs. short) was used as a discriminant binary variable.
