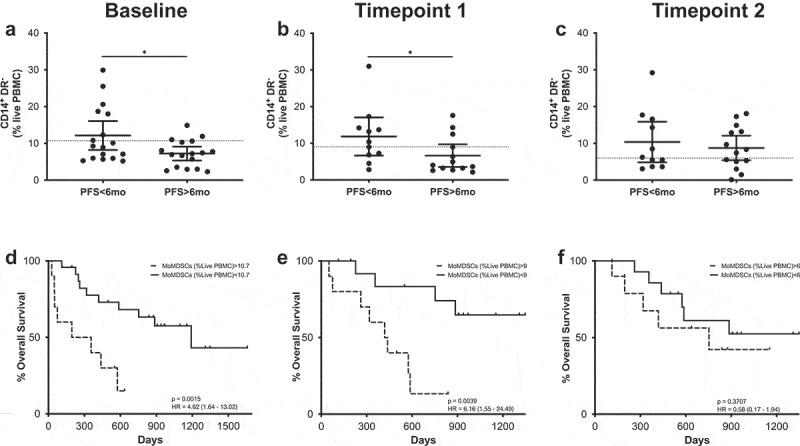
Figure 6.

MoMDSCs predict MOS and PFS. (a-c) Frequencies of CD14+HLA-DR− cells in patients with long and short PFS at baseline (a), timepoint 1 (b) and timepoint 2 (c). Each dot represents an individual patient, the dashed line represents the cutoff point that divides each parameter into high and low as calculated using Cutoff Finder software; mean ±95% CI are represented. Unpaired t-test: *, P < .05. (d-f) Kaplan-Meier survival analysis baseline (d), timepoint 1 (e) and timepoint 2 (f) after cutoff determination.
