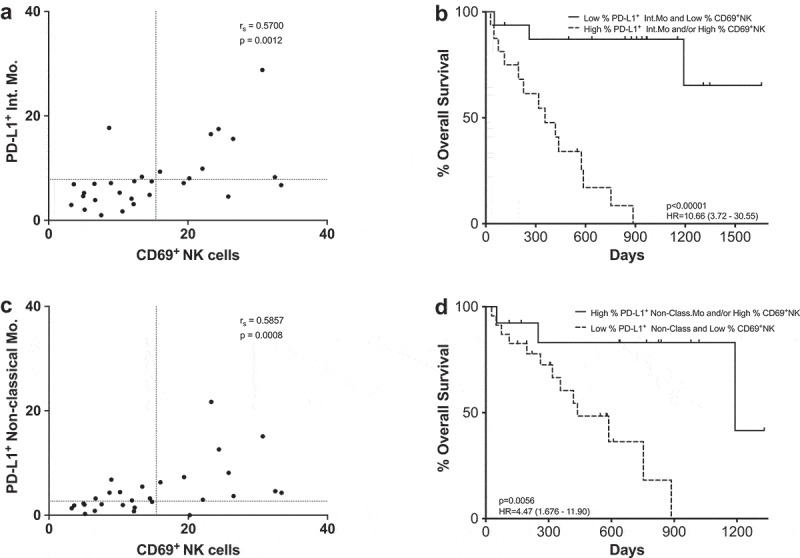
Figure 8.

CD69+ NK cells and PD-L1+ as a combined predictive biomarker. (a,c) Spearman correlation between CD69+ NK cells and PD-L1+ intermediate monocytes (a) or PD-L1+ non-classical monocytes (c). Each dot represents an individual patient, dashed lines represent the cutoff point that divides each parameter into high and low as calculated using Cutoff Finder software. (b,d) Kaplan-Meier survival analysis of the combined populations: CD69+ NK cells and PD-L1+ intermediate monocytes (b); CD69+ NK cells and PD-L1+ non-classical monocytes (d).
